. 2019 Jan 2;5(1):eaav0216.
doi: 10.1126/sciadv.aav0216. eCollection 2019 Jan.

MRGPR-mediated activation of local mast cells clears cutaneous bacterial infection and protects against reinfection

Affiliations

MRGPR-mediated activation of local mast cells clears cutaneous bacterial infection and protects against reinfection

Mohammad Arifuzzaman et al. Sci Adv. .

Abstract

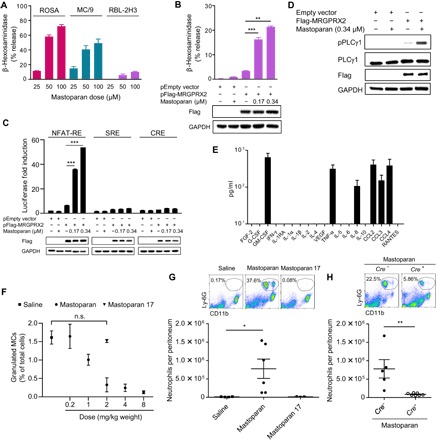
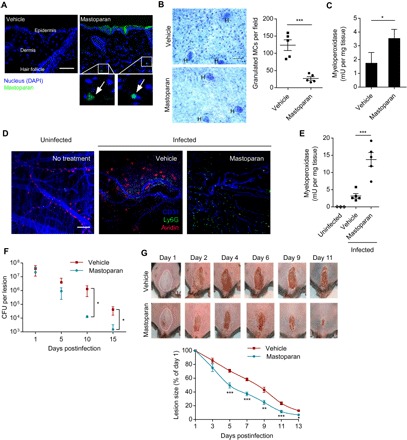
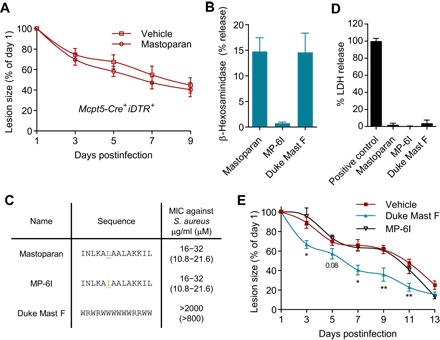
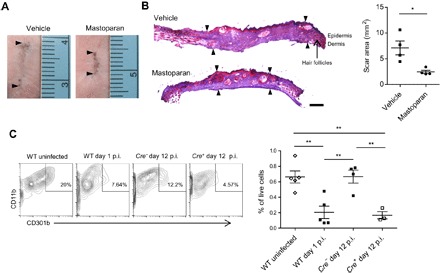
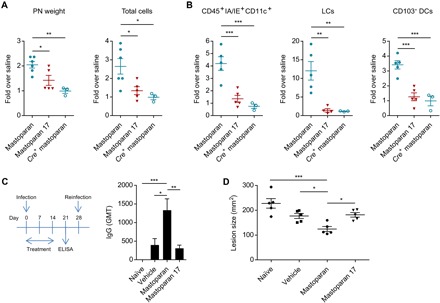
Mast cells (MCs) are strategically distributed at barrier sites and prestore various immunocyte-recruiting cytokines, making them ideal targets for selective activation to treat peripheral infections. Here, we report that topical treatment with mastoparan, a peptide MC activator (MCA), enhances clearance of Staphylococcus aureus from infected mouse skins and accelerates healing of dermonecrotic lesions. Mastoparan functions by activating connective tissue MCs (CTMCs) via the MRGPRX2 (Mas-related G protein-coupled receptor member X2) receptor. Peripheral CTMC activation, in turn, enhances recruitment of bacteria-clearing neutrophils and wound-healing CD301b+ dendritic cells. Consistent with MCs playing a master coordinating role, MC activation also augmented migration of various antigen-presenting dendritic cells to draining lymph nodes, leading to stronger protection against a second infection challenge. MCAs therefore orchestrate both the innate and adaptive immune arms, which could potentially be applied to combat peripheral infections by a broad range of pathogens.


Figures

Fig. 1
Fig. 1. CTMCs control skin infection via neutrophil recruitment.
(A) Schematic plan for CTMC depletion, dermonecrotic infection, and lesion measurement. (B) Neutrophil recruitment at 4 hours after intradermal infection of MC-sufficient (Cre) or MC-deficient (Cre+) mice with 108 S. aureus, assessed by myeloperoxidase (MPO) assay (n = 4 to 5). (C) Quantification of bacteria in the infected skin tissues at 24 hours after infection (n = 5). Colony forming units (CFUs) were determined by plating on LB agar. (D) Representative images of skin lesions taken on indicated days after infection. Black dotted lines delineate area of infection on day 1. The graph at the bottom represents size of skin lesions in different mouse groups measured on indicated days and area calculated using ImageJ (n = 5). (E) Initial lesion sizes in neutrophil-depleted MC-sufficient (Cre) or neutrophil-depleted MC-deficient (Cre+) mice, measured 24 hours after infection with S. aureus (n = 7). Note that initial lesions in neutrophil-depleted mice were larger compared with those in neutrophil-sufficient mice shown in (D). Data are representative of two independent experiments. Data were analyzed via unpaired two-tailed Student’s t test. Error bars represent SEM. *P < 0.05, **P < 0.01, n.s., not significant. DT, diphtheria toxin.
Fig. 2
Fig. 2. CTMC activation via MRGPRX2 receptor recruits neutrophils.
(A) Degranulation of a human MC line (ROSA), a murine CTMC line (MC/9), and a rat MC-like cell line (RBL-2H3) in vitro expressed as β-hexosaminidase release by increasing concentrations of mastoparan. (B) Degranulation of RBL-2H3 cells transfected with expression construct encoding MRGPRX2 or empty vector followed by mastoparan stimulation. Immunoblots show the introduction of MRGPRX2 in the cells and glyceraldehyde-3-phosphate dehydrogenase (GAPDH) as a loading control. (C) Luciferase reporter activities triggered by mastoparan in mock- or MRGPRX2-transfected HEK293 cells coexpressing NFAT-RE, SRE, or CRE (representing the Gαq, Gi/o, or Gαs pathway, respectively). Immunoblots show the MRGPRX2 expression and loading control GAPDH. (D) Immunoblot analysis of lysates prepared from RBL-2H3 cells (mock or MRGPRX2 transfected) stimulated with mastoparan for 5 min and probed for phospho-PLCγ1, PLCγ1, Flag, and GAPDH. Data are presented as the mean of triplicate values in one experiment, representative of at least two independent experiments. (E) Cytokines (prestored or de novo synthesized) secreted by a human MC line (LAD2) upon stimulation with mastoparan (25 μM) for 20 hours, measured by a Luminex multiplex fluorescence immunoassay. Data represent mean of triplicate values in a single experiment. (F) Quantification of granulated MCs in the peritoneal lavage of mice 30 min after intraperitoneal injection with various doses of mastoparan (0.2 to 8 mg/kg bodyweight; n = 3) or controls. (G) Numbers of neutrophils per peritoneum 2 hours after intraperitoneal injection with saline or 2 mg/kg bodyweight of mastoparan. Data represent two independent experiments (n = 3 to 6). Flow cytometry plots represent percentages of CD11b+Ly6G+ neutrophils in the peritoneums of each group of mice. (H) Numbers of neutrophils per peritoneum 2 hours after intraperitoneal injection 2 mg/kg bodyweight of mastoparan. Flow cytometry plots represent percentages of neutrophils in peritoneums of MC-sufficient or MC-deficient mice. Data represent two independent experiments (n = 5 to 7). Data were analyzed via unpaired two-tailed Student’s t test or one-way analysis of variance (ANOVA). Error bars represent SEM. *P < 0.05, **P < 0.01, ***P < 0.001, n.s., not significant. IFN, interferon.
Fig. 3
Fig. 3. MCA-mediated neutrophil recruitment accelerates bacterial clearance in the skin.
(A) Representative images of mouse dorsal skin cross sections collected at 2 hours after topical application of 10 μg of mastoparan-FITC or vehicle (n = 2 to 3). Arrows point to the fluorescent peptide detected within dermis. Scale bar, 50 μm. (B) Representative whole-mount images showing granulated MCs in vehicle- and mastoparan-treated ear tissue 2 hours after treatment. “H” indicates hair follicle. Scale bar, 50 μm. Graph shows quantification of granulated MCs in each treatment group (n = 5). (C) Quantification of neutrophils in dorsal skins of each treatment group using MPO assay 6 hours after treatment (n = 3). (D) Representative whole mount of the dorsal skin following no infection or treatment (left), intradermal infection (108 S. aureus) and topical treatment with vehicle (middle), or mastoparan (right). The infected mice were treated twice daily and sacrificed 4 hours after treatment on day 5; skin tissues adjacent to scabs were stained for avidin (red), Ly6G (green), and CD31 (blue). Notice that in the mastoparan-treated tissue, MCs are not visible because they are degranulated, and numerous neutrophils appear in the image. Scale bar, 100 μm. (E) Quantification of neutrophils (MPO) in the skins of each group of mice 4 hours after treatment on day 7 (n = 3 to 5). (F) Quantification of bacteria in the infected skin tissues at different time points after infection (n = 4 to 5). (G) Representative images of skin lesions taken on indicated days after infection and treatment. White dotted lines delineate area of infection on day 1. The graph at the bottom represents size of skin lesions in different treatment groups measured on indicated days and area calculated using ImageJ (n = 10). Data are representative of at least two independent experiments. Data were analyzed via unpaired two-tailed Student’s t test or ANOVA. Error bars represent SEM. *P < 0.05, **P < 0.01, ***P < 0.001.
Fig. 4
Fig. 4. Therapeutic effect of mastoparan is specific to MC activation.
(A) Quantification of lesion sizes at indicated days after infection of MC-depleted mice and vehicle or mastoparan treatment (n = 6 to 7). Note that healing rates in MC-depleted mice were slower than that in MC-sufficient mice due to larger initial lesions. Data represent two independent experiments. (B) Degranulation of MC/9 cells expressed as β-hexosaminidase release by 25 μM mastoparan, MP-6I, and Duke Mast F. (C) Amino acid sequence and MIC (minimum inhibitory concentration) for mastoparan or each of its analogs. (D) Cytotoxicity of mastoparan or its analogs measured by LDH assay 4 hours after incubation of L929 cells at a concentration of 50 μM. (E) Quantification of lesion sizes in each treatment group (n = 5). Data were analyzed via unpaired two-tailed Student’s t test or one-way ANOVA. Error bars represent SEM. *P < 0.05, **P < 0.01.
Fig. 5
Fig. 5. Treatment with MCA promotes regenerative healing.
(A) Representative images of skin scars from different mouse groups taken on day 28 after infection. Arrowheads indicate the length of scars. (B) Representative cryosections from scarred regions. The sections taken were perpendicular to the long axis of the scar. Arrowheads define the area of scar regions devoid of hair follicles. Scale bar, 500 μm. The graph on the right represents area of the scar in each group measured using ImageJ (n = 4). (C) Representative flow cytometry plots depicting the CD11b+CD301b+ DDC population in skins of mice of indicated groups. Cells within the CD45+CD64loCD11c+ gate are shown. Graph shows skin CD301b+ DDCs as percentage of total live cells (n = 3 to 5). Data are representative of at least two independent experiments. Data were analyzed via unpaired two-tailed Student’s t test or ANOVA. Error bars represent SEM. *P < 0.05, **P < 0.01. p.i., postinfection; WT, wild type.
Fig. 6
Fig. 6. MCA boosts adaptive immunity and controls reinfection.
(A) Weight of PNs and total number of cells in the PN 24 hours after footpad injection of WT mice with saline, 10 μg of mastoparan, or mastoparan 17, or MC-depleted mice with mastoparan (Cre+ mastoparan group). (B) Numbers of CD11c+ IA/IE+ antigen-presenting cells, LCs, and CD103+ DCs in PNs 24 hours after various treatments described above. Data are representative of two independent experiments. (C) Schematic showing experimental plan and graph depicting IgG geometric mean titer (GMT) against whole S. aureus cells in sera collected on day 21 after infection from mice infected with S. aureus and treated with vehicle, mastoparan, or mastoparan 17 for 2 weeks or in sera of uninfected (naïve) mice (n = 5). (D) Lesion size 24 hours after reinfection with 108 S. aureus of mouse groups described above (n = 5). Note that the lesion sizes were larger since the bacteria were not coated with microbeads (see Materials and Methods). Data were analyzed via unpaired two-tailed Student’s t test or ANOVA. Error bars represent SEM. *P < 0.05, **P < 0.01, ***P < 0.001. ELISA, enzyme-linked immunosorbent assay.

References

    1. Abraham S. N., St. John A. L., Mast cell-orchestrated immunity to pathogens. Nat. Rev. Immunol. 10, 440–452 (2010). - PMC - PubMed
    1. Marshall J. S., Mast-cell responses to pathogens. Nat. Rev. Immunol. 4, 787–799 (2004). - PubMed
    1. Shelburne C. P., Abraham S. N., The mast cell in innate and adaptive immunity. Adv. Exp. Med. Biol. 716, 162–185 (2011). - PubMed
    1. Gendrin C., Vornhagen J., Ngo L., Whidbey C., Boldenow E., Santana-Ufret V., Clauson M., Burnside K., Galloway D. P., Waldorf K. M. A., Piliponsky A. M., Rajagopal L., Mast cell degranulation by a hemolytic lipid toxin decreases GBS colonization and infection. Sci. Adv. 1, e1400225 (2015). - PMC - PubMed
    1. St. John A. L., Rathore A. P. S., Yap H., Ng M.-L., Metcalfe D. D., Vasudevan S. G., Abraham S. N., Immune surveillance by mast cells during dengue infection promotes natural killer (NK) and NKT-cell recruitment and viral clearance. Proc. Natl. Acad. Sci. U.S.A. 108, 9190–9195 (2011). - PMC - PubMed

Publication types

MeSH terms

LinkOut - more resources