Estimation of the distribution of longitudinal biomarker trajectories prior to disease progression
- PMID: 30614014
- PMCID: PMC6501595
- DOI: 10.1002/sim.8085
Estimation of the distribution of longitudinal biomarker trajectories prior to disease progression
Abstract
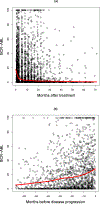
Most studies characterize longitudinal biomarker trajectories by looking forward at them from a commonly used time origin, such as the initial treatment time. For a better understanding of the relationship between biomarkers and disease progression, we propose to align all subjects by using their disease progression time as the origin and then looking backward at the biomarker distributions prior to that event. We demonstrate that such backward-looking plots are much more informative than forward-looking plots when the research goal is to understand the shape of the trajectory leading up to the event of interest. Such backward-looking plotting is an easy task if disease progression is observed for all the subjects. However, when these events are censored for a significant proportion of subjects in the study cohort, their time origins cannot be identified, and the task of aligning them cannot be performed. We propose a new method to tackle this problem by considering the distributions of longitudinal biomarker data conditional on the failure time. We use landmark analysis models to estimate these distributions. Compared to a naïve method, our new method greatly reduces estimation bias. We apply our method to a study for chronic myeloid leukemia patients whose BCR-ABL transcript expression levels after treatment are good indicators of residual disease. Our proposed method provides a good visualization tool for longitudinal biomarker studies for the early detection of disease.
Keywords: biomarker; disease recurrence; landmark analysis; survival analysis.
© 2019 John Wiley & Sons, Ltd.
Figures


References
-
- Shet AS, Jahagirdar BN, Verfaillie CM. Chronic myelogenous leukemia: mechanisms underlying disease progression. Leukemia. 2002;16:1402–1411. - PubMed
-
- Liu L, Wolfe RA, Kalbfleisch JD. A shared random effects model for censored medical costs and mortality. Stat Med. 2007;26(1):139–55. - PubMed
-
- Cox DR. Regression models and life tables (with discussion). J R Stat Soc Series B Stat Methodol. 1972;34:187–200.
-
- Heitjan DF, Rubin DB. Ignorability and coarse data. Ann Stat. 1991;19:2244–2253.
Publication types
MeSH terms
Substances
Grants and funding
LinkOut - more resources
Full Text Sources
Miscellaneous
