

Biexponential T1ρ relaxation mapping of human knee menisci
- PMID: 30614152
- PMCID: PMC7592083
- DOI: 10.1002/jmri.26631
Biexponential T1ρ relaxation mapping of human knee menisci
Abstract
Background: Measuring T1ρ in the knee menisci can potentially be used as noninvasive biomarkers in detecting early-stage osteoarthritis (OA).
Purpose: To demonstrate the feasibility of biexponential T1ρ relaxation mapping of human knee menisci.
Study type: Prospective.
Population: Eight healthy volunteers with no known inflammation, trauma, or pain in the knee and three symptomatic subjects with early knee OA.
Field strength/sequence: Customized Turbo-FLASH sequence to acquire 3D-T1ρ -weighted images on a 3 T MRI scanner.
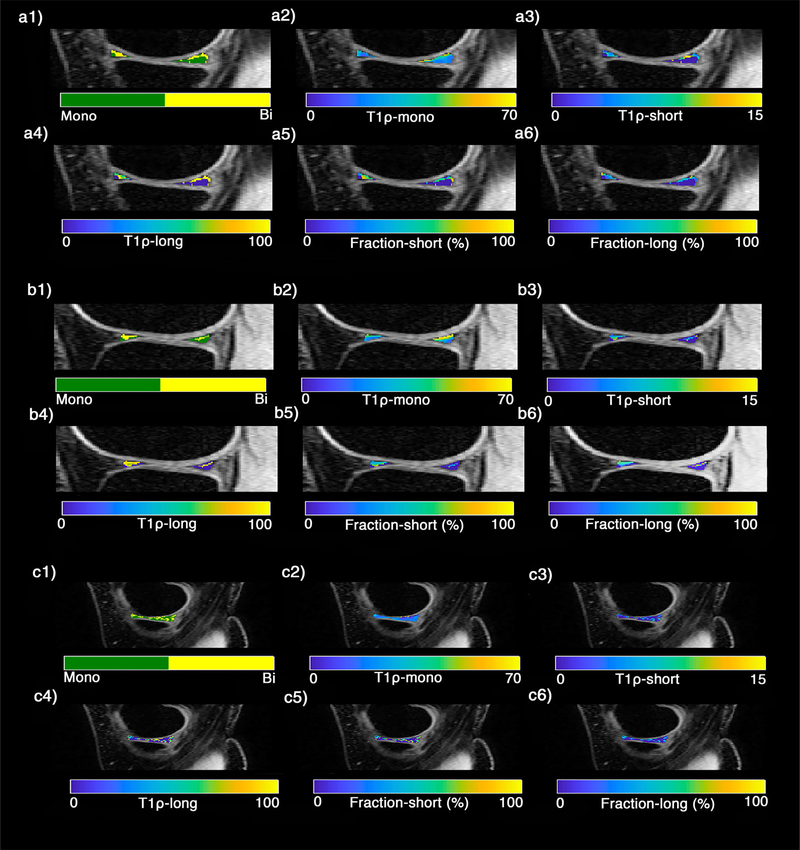
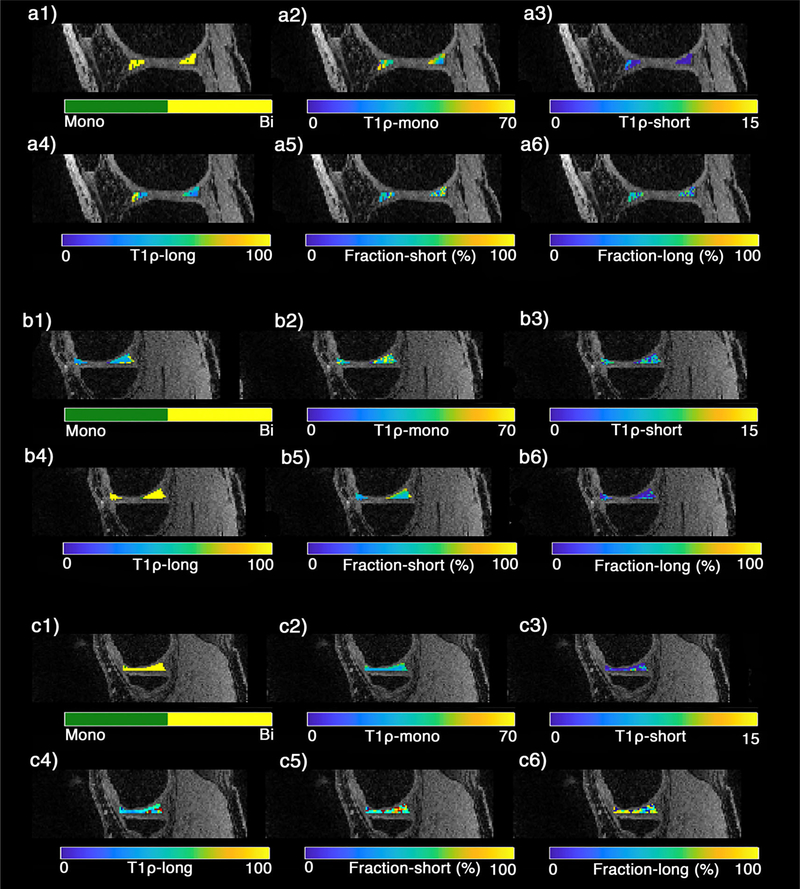
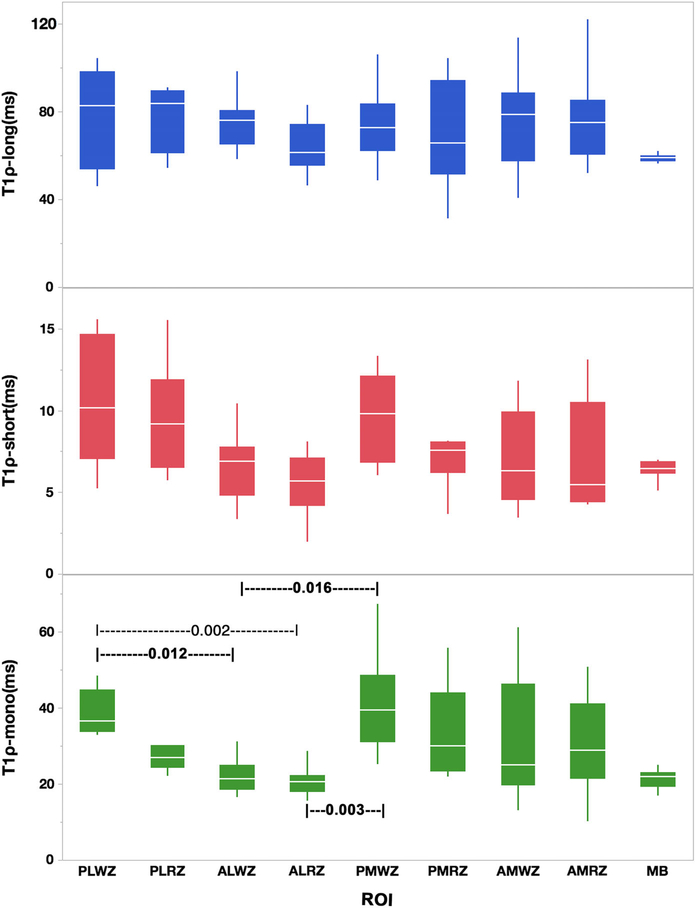
Assessment: T1ρ relaxation values were assessed in 11 meniscal regions of interest (ROIs) using monoexponential and biexponential models.
Statistical tests: Nonparametric rank-sum tests, Kruskal-Wallis test, and coefficient of variation.
Results: The mean monoexponential T1ρ relaxation in the lateral menisci were 28.05 ± 4.2 msec and 37.06 ± 10.64 msec for healthy subjects and early knee OA patients, respectively, while the short and long components were 8.07 ± 0.5 msec and 72.35 ± 3.2 msec for healthy subjects and 2.63 ± 2.99 msec and 55.27 ± 24.76 msec for early knee OA patients, respectively. The mean monoexponential T1ρ relaxation in the medial menisci were 34.30 ± 3.8 msec and 37.26 ± 11.38 msec for healthy and OA patients, respectively, while the short and long components were 7.76 ± 0.7 msec and 72.19 ± 4.2 msec for healthy subjects and 3.06 ± 3.24 msec and 55.27 ± 24.59 msec for OA patients, respectively. Statistically significant (P ≤ 0.05) differences were observed in the monoexponential relaxation between some of the ROIs. The T1ρ,short was significantly lower (P = 0.02) in the patients than controls. The rmsCV% ranges were 1.51-16.6%, 3.59-14.3%, and 4.91-15.6% for T1ρ -mono, T1ρ -short, and T1ρ -long, respectively.
Data conclusion: Our results showed that in all ROIs, T1ρ relaxation times of outer zones (red zones) were less than inner zones (white zones). Monoexponential T1ρ was increased in medial, lateral, and body menisci of early OA while the biexponential numbers were decreased in early OA patients.
Level of evidence: 2 Technical Efficacy Stage: 1 J. Magn. Reson. Imaging 2019. J. Magn. Reson. Imaging 2019;50:824-835.
Keywords: bicomponent T1ρ relaxation; biexponential and monoexponential T1ρ; knee menisci.
© 2019 International Society for Magnetic Resonance in Medicine.
Figures


References
-
- Englund M, Niu J, Guermazi A, et al. Effect of meniscal damage on the development of frequent knee pain, aching, or stiffness. Arthritis Rheum 2007;56:4048–4054. - PubMed
-
- Mosher TJ, Liu Y, Yang QX, et al. Age dependency of cartilage magnetic resonance imaging T2 relaxation times in asymptomatic women. Arthritis Rheum 2004;50:2820–2828. - PubMed
Publication types
MeSH terms
Grants and funding
LinkOut - more resources
Full Text Sources
Research Materials
