. 2019 Apr;18(2):e12889.
doi: 10.1111/acel.12889. Epub 2019 Jan 6.

Circumventing senescence is associated with stem cell properties and metformin sensitivity

Affiliations

Circumventing senescence is associated with stem cell properties and metformin sensitivity

Xavier Deschênes-Simard et al. Aging Cell. 2019 Apr.

Abstract

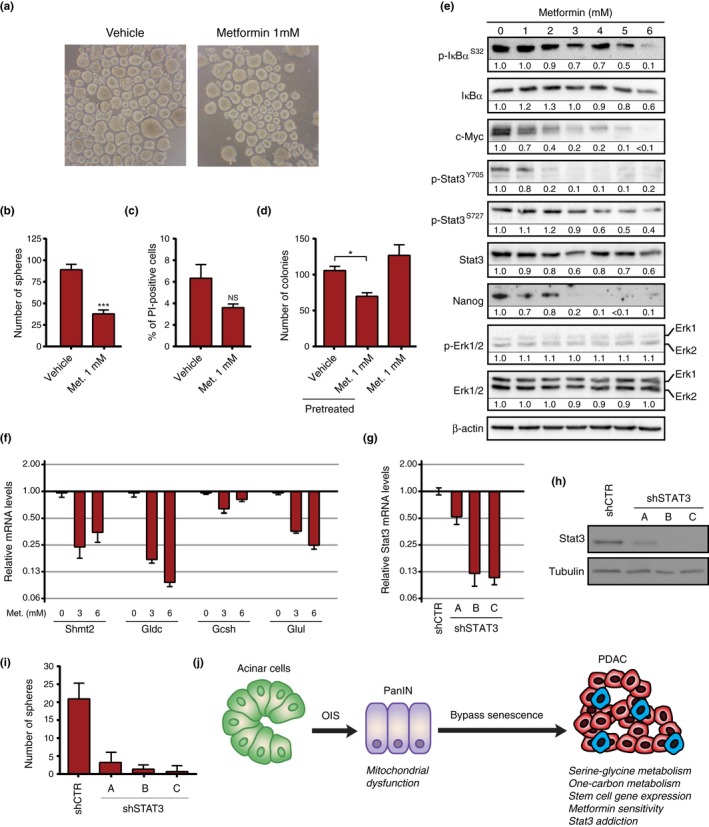
Most cancers arise in old individuals, which also accumulate senescent cells. Cellular senescence can be experimentally induced by expression of oncogenes or telomere shortening during serial passage in culture. In vivo, precursor lesions of several cancer types accumulate senescent cells, which are thought to represent a barrier to malignant progression and a response to the aberrant activation of growth signaling pathways by oncogenes (oncogene toxicity). Here, we sought to define gene expression changes associated with cells that bypass senescence induced by oncogenic RAS. In the context of pancreatic ductal adenocarcinoma (PDAC), oncogenic KRAS induces benign pancreatic intraepithelial neoplasias (PanINs), which exhibit features of oncogene-induced senescence. We found that the bypass of senescence in PanINs leads to malignant PDAC cells characterized by gene signatures of epithelial-mesenchymal transition, stem cells, and mitochondria. Stem cell properties were similarly acquired in PanIN cells treated with LPS, and in primary fibroblasts and mammary epithelial cells that bypassed Ras-induced senescence after reduction of ERK signaling. Intriguingly, maintenance of cells that circumvented senescence and acquired stem cell properties was blocked by metformin, an inhibitor of complex I of the electron transport chain or depletion of STAT3, a protein required for mitochondrial functions and stemness. Thus, our studies link bypass of senescence in premalignant lesions to loss of differentiation, acquisition of stemness features, and increased reliance on mitochondrial functions.


Conflict of interest statement

None declared.

Figures

Figure 1
Figure 1
Establishment of an in vitro model of pancreatic cancer progression. (a) Illustration of stages in pancreatic cancer progression after oncogenic ras activation (Kras*) in vivo. Adapted from Wilentz et al. (2000). Mouse pancreatic ductal cell lines were established from the indicated lesions of Pdx1‐Cre;LSL‐KrasG12Dmice. (b) Proliferation of the indicated mouse cell lines measured by MTT. The relative proliferation represents the fold of OD at 500 nm over the indicated period of time. Each point represents the mean of triplicates ± SD. (c) Cell lines from pancreatic ductal adenocarcinoma (PDAC) form colonies in soft agar, but not cell lines from ADM/PanIN1 lesions. Scale bar = 400 μm. (d) Quantification of proliferation in soft agar over a period of 7 days for the indicated cell lines. Results were obtained using the CyQuant GR dye and are expressed as relative fluorescence unit (RFU) at 520 nm. Mean of triplicates ± SD, **p < 0.01. (e) Tumor volume and weight 15 days after subcutaneous injection of 5 × 105 1,499 or AH375 cells into SCID mice. Only AH375 cells form tumors. (f) Phenotype and histology of subcutaneous tumors formed by AH375 cells. H&E, hematoxylin and eosin. Black arrow, ductal histology (g) Phenotype and histology of tumors formed following orthotopic injection of AH375 cells into the pancreas of SCID mice. H&E, hematoxylin and eosin; AC, normal acinar cells; S, spleen; T, tumor. (h) Percentage of SA‐β‐Gal‐positive cells in the indicated cell lines. The average and SD of triplicates of 100 cells counts are indicated at the bottom of each panel, n = 3. Scale bar = 10 μm. (i) Indirect immunofluorescence staining with anti‐γ‐H2AX and anti‐p53BP1 antibodies of PDAC cell line AH375 and PanIN cell line 1,498, scale bar = 10 μm. The percentage of cells with more than five foci is indicated at the bottom right of each panel. (j) Indirect immunofluorescence staining with anti‐HP1γ antibody of PDAC cell line AH375 and PanIN cell line 1,498, scale bar = 10 μm. The percentage of cells with more than five foci is indicated at the bottom right of each panel. We counted 50 cells three times in two independent experiments
Figure 2
Figure 2
Stemness gene expression pattern in pancreatic ductal adenocarcinoma cells. (a) Transcriptome analysis comparing 1,499 and AH375 cells (GEO accession number: GSE57566). Transcripts with a fold change higher or equal to 2 and a p < 0.05 according to a two‐sample Student's t test were analyzed with the Babelomics 4.3 platform. The number of transcripts in each category (nonmutually exclusive) is indicated. (b) Validation by qPCR of the microarray data in the indicated cell lines and for the indicated genes, which are involved in epithelial‐mesenchymal transition (EMT). Mean of triplicates ± SD. (c) DIRE prediction of upregulated transcription factors (TF) in AH375 cells. The percentage of target genes found in the submitted list of transcripts is shown for each potential TF (occurrence). The importance indicates the product of a TF occurrence with its weight in the database. (d) GSEA found gene expression signatures suggesting upregulation of Stat3 and c‐Myc in AH375 cells. (e) Immunoblots with anti‐phospho‐Stat3 (Y705), anti‐Stat3, and anti‐c‐Myc antibodies on extracts from the indicated cell lines. (f) Histology of lung tumors formed after tail vein injection of 1 × 106 AH375 cells into SCID mice. B, bronchiole; AV, alveolus; M and black arrows, tumors. H&E, hematoxylin and eosin (g) Indirect immunofluorescence staining with anti‐Myc and anti‐phospho‐ERK antibody of mouse lung tissues containing tumors as in (f). White arrows, metastasis; DAPI, nuclear counter stain; scale bar = 100 μm
Figure 3
Figure 3
Ras‐transformed mouse embryonic fibroblasts (MEFs) and human primary cells show a reprogrammed gene expression profile associated with dedifferentiation. (a) RNA from IMR90 cells stably expressing hTERT, HRasG12V, and a shRNA against ERK2 (shERK) or a non‐targeting shRNA (shCTR) was collected for microarray gene expression analysis (GEO accession number: GSE33613). GSEA revealed gene expression signatures of genes known as downregulated by active MEK in cells expressing a shERK2 (MEK UP.V1 DN; M2724) and genes known as upregulated by active MEK in cells expressing a shCTR (MEK UP.V1 UP; M2725). (b) A total of 991 transcripts with a fold change higher or equal to 2 and a p < 0.05 following a two‐sample Student's t test were analyzed with the Babelomics 4.3 platform. The terms obtained which may explain the transformed phenotype of the IMR90 hTERT/HRasG12V/shERK2‐expressing cells and their associated transcripts are grouped in the indicated general categories. The number of transcripts in each category (nonmutually exclusive) is indicated. (c) Several stem cell gene expression signatures showing dedifferentiation in IMR90 hTERT/HRasG12V/shERK2‐expressing cells were revealed by GSEA. (d) GSEA for the most significant signature in (c) (WONG EMBRYONIC STEM CELL CORE; M7079). (e) Gene expression signatures suggesting upregulation of STAT3, c‐MYC, and the WNT pathway in IMR90 hTERT/HRasG12V/shERK2‐expressing cells. (f) Immunoblots for the indicated proteins in extracts from wild‐type (WT) or Erk2‐null MEF, and IMR90 or human mammary epithelial cell (HMEC) cells expressing hTERT and the indicated vectors: shCTR, nontargeting shRNA; shERK, shRNA targeting ERK2; V, empty vector; R, vector expressing HRasG12V
Figure 4
Figure 4
A subpopulation of cells that bypass senescence have a behavior of cancer stem cells. (a) Cell lines from pancreatic ductal adenocarcinoma form free‐floating tumor spheres, but not cell lines from ADM/PanIN1 lesions. Scale bar = 400 μm. (b) Quantification of cell proliferation in (a) with the WST‐1 cell proliferation assay. The fold of absorbance at 450 nm over a period of 14 days is shown. Average of triplicates ± SD, **p < 0.01. (c) Tumor sphere formation assay with wild‐type or Erk2‐null mouse embryonic fibroblast (MEF) expressing the indicated vectors. Scale bar = 200 μm. (d) Tumor sphere formation assay with human mammary epithelial cell (HMEC) and IMR90 cells expressing hTERT and the indicated vectors. shCTR: control nontargeting shRNA, shERK: shRNA against ERK2. Scale bar = 200 μm. (e–g) Number of spheres from an initial plating of 1,000 cells; (e) MEF, (f) HMEC, (g) IMR90. Average of triplicates ± SD, *p < 0.05, **p < 0.01 versus WT + V or NTC + V. (h) LPS stimulates the conversion of PanIN cells into tumor sphere‐forming cells. Representative pictures of spheres formed by LPS‐ or vehicle‐pretreated 1,497 cells and of NB508 cells grown in suspension. Note that LPS pretreatment was performed on adherent cells, whereas no LPS was added in culture medium when LPS‐pretreated cells were seeded in suspension (i) Quantification of sphere number. Average of six replicates ± SD, ***p < 0.001, ****p < 0.0001, V = vehicle
Figure 5
Figure 5
Increased mitochondrial gene expression in pancreatic cancer cells. (a) An analysis of the microarray data as in Figure 2 (AH375 vs. 1,499 cells) with DAVID 6.7 revealed a mitochondrial gene expression signature (92 genes). (b) The mitochondrial gene expression signature found by DAVID 6.7 regrouped the indicated GO and KEGG terms. (c) QPCR validation of the indicated genes in AH375 and NB508 pancreatic ductal adenocarcinoma cells in comparison with 1,498 and 1,499 PanIN cells. Error bars represent mean ± SD. (d) Sorting AH375 cells based on MitoTracker Green staining. (e) Representative tumor spheres of unsorted AH375 or cells sorted according to MitoTracker Green staining as in (d). (f) Quantification of AH375 cells tumor sphere formation of unsorted or sorted subpopulations with MitoTracker Green low versus high as in (d). Average of triplicates ± SD, **p < 0.01, ***p < 0.001, ****p < 0.0001 using ANOVA. (g) Flow cytometry quantification of MitoTracker Green staining of AH375 cells growing in 2D culture or as tumor spheres (3D culture). Average of triplicates ± SD, **p < 0.01 using Student's t test. (h) Flow cytometry quantification of relative MitoTracker Green staining median intensity in LPS‐ or vehicle‐pretreated 1,497 cells. Average of triplicates ± SD, ****p < 0.0001 using Student's t test
Figure 6
Figure 6
Pretreatment with metformin reduces the ability of AH375 pancreatic ductal adenocarcinoma (PDAC) cells to form tumor spheres. (a) AH375 cells pretreated with metformin or vehicle. (b) Quantitation of tumor spheres as in (a). Average of replicates ± SD, ***p < 0.001, n = 3. (c) Quantitation of AH375 cell viability using propidium iodide (PI) after treatment with metformin or vehicle. NS = not significant. (d, e) Immunoblots for the indicated proteins in extracts from AH375 cells treated with the indicated concentrations of metformin for six days. (f) QPCR for mitochondrial genes in AH375 cells treated with the indicated doses of metformin for 5 days. Error bars indicate mean ± SD. (g) QPCR for Stat3 expression in NB508 expressing a nontargeting control shRNA (shNTC) or different shRNAs against Stat3. (h) Immunoblots for Stat3 and tubulin as in (g). (i) Number of tumor spheres in cells as in (g) after 5 days. Spheres were counted by microscopic examination. Average of quadruplicate ± SD. (j) Bypassing senescence and mitochondrial reprogramming in carcinogenesis. Premalignant lesions are first halted by oncogene‐induced senescence, but some cells can bypass the process. This involves an enrichment for stemness genes, mitochondrial genes, and a subpopulation of metformin‐sensitive tumor‐initiating cells (blue cells in the figure)

References

    1. Acosta, J. C. , Banito, A. , Wuestefeld, T. , Georgilis, A. , Janich, P. , Morton, J. P. , … Gil, J. (2013). A complex secretory program orchestrated by the inflammasome controls paracrine senescence. Nature Cell Biology, 15(8), 978–990. 10.1038/ncb2784 - DOI - PMC - PubMed
    1. Ben‐Porath, I. , Thomson, M. W. , Carey, V. J. , Ge, R. , Bell, G. W. , Regev, A. , & Weinberg, R. A. (2008). An embryonic stem cell‐like gene expression signature in poorly differentiated aggressive human tumors. Nature Genetics, 40(5), 499–507. 10.1038/ng.127 - DOI - PMC - PubMed
    1. Caldwell, M. E. , DeNicola, G. M. , Martins, C. P. , Jacobetz, M. A. , Maitra, A. , Hruban, R. H. , & Tuveson, D. A. (2012). Cellular features of senescence during the evolution of human and murine ductal pancreatic cancer. Oncogene, 31(12), 1599–1608. 10.1038/onc.2011.350 - DOI - PMC - PubMed
    1. Campbell, K. J. , Rocha, S. , & Perkins, N. D. (2004). Active repression of antiapoptotic gene expression by RelA(p65) NF‐kappa B. Molecular Cell, 13(6), 853–865. - PubMed
    1. Chen, K. , Qian, W. , Jiang, Z. , Cheng, L. , Li, J. , Sun, L. , … Ma, Q. (2017). Metformin suppresses cancer initiation and progression in genetic mouse models of pancreatic cancer. Molecular Cancer, 16(1), 131 10.1186/s12943-017-0701-0 - DOI - PMC - PubMed

Publication types