Review
. 2019 May;66(5):e27595.
doi: 10.1002/pbc.27595. Epub 2019 Jan 6.

Assessment of circulating tumor DNA in pediatric solid tumors: The promise of liquid biopsies

Affiliations
Review

Assessment of circulating tumor DNA in pediatric solid tumors: The promise of liquid biopsies

Samuel D Abbou et al. Pediatr Blood Cancer. 2019 May.

Abstract

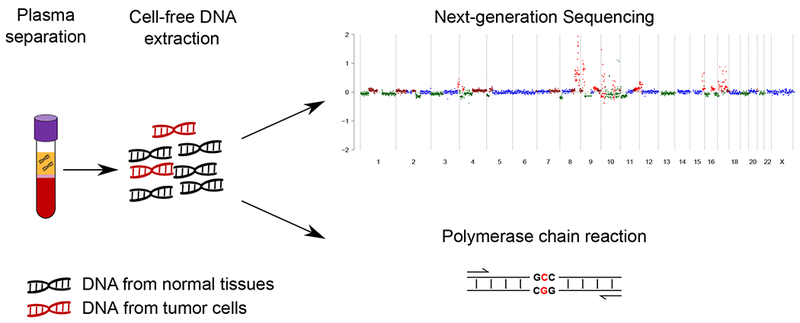
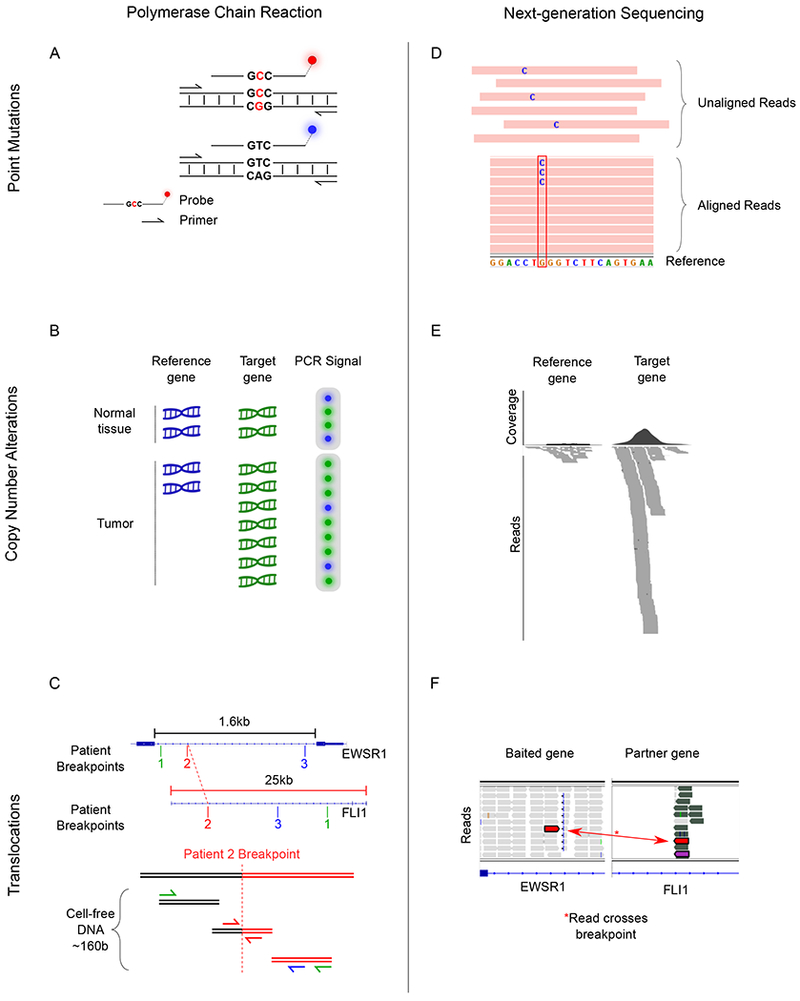
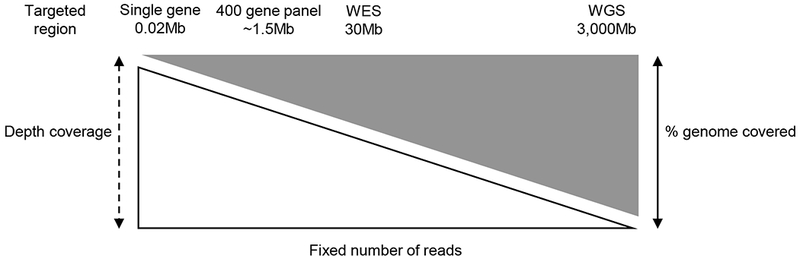
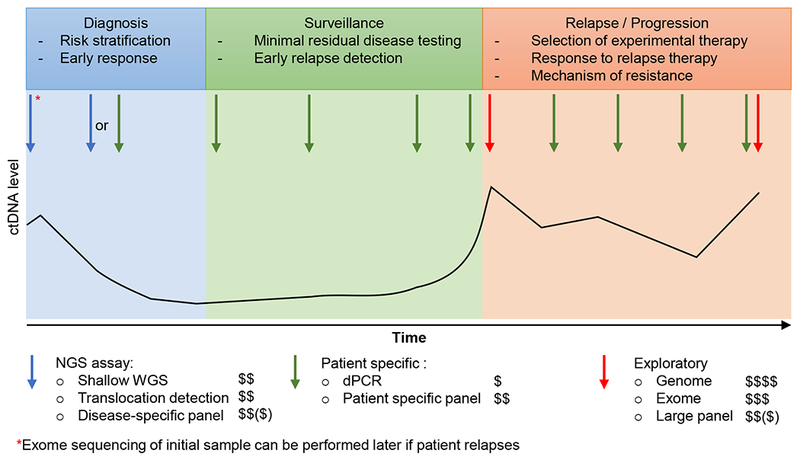
Circulating tumor DNA can be detected in the blood and body fluids of patients using ultrasensitive technologies, which have the potential to improve cancer diagnosis, risk stratification, noninvasive tumor profiling, and tracking of treatment response and disease recurrence. As we begin to apply "liquid biopsy" strategies in children with cancer, it is important to tailor our efforts to the unique genomic features of these tumors and address the technical and logistical challenges of integrating biomarker testing. This article reviews the literature demonstrating the feasibility of applying liquid biopsy to pediatric solid malignancies and suggests new directions for future studies.

Keywords: circulating tumor DNA; digital PCR; liquid biopsy; next-generation sequencing; pediatric cancer.


Conflict of interest statement

Conflict of Interest statement: The authors declare that there is no conflict of interest regarding the publication of this article.

Figures

Figure 1.
Figure 1.. Overview of cell-free DNA extraction and processing.
Cartoon depicts the presence of cell-free DNA in the plasma layer of a blood sample collected in an EDTA tube (left). The extracted cell-free DNA is a mixture of DNA originating from normal tissues (black strands of DNA) and DNA originating from tumor cells (red strands of ctDNA), the latter being often a small fraction of the total DNA in the sample (middle). Identifying and quantifying ctDNA from a cell-free DNA sample requires detection of somatic variants that are present only in the tumor. This is typically done with either next-generation sequencing or polymerase chain reaction assays (right).
Figure 2.
Figure 2.. PCR and next-generation sequencing approaches to detecting somatic variants in cell-free DNA.
A) Image depicts the ability to detect DNA with single-nucleotide variants (top) from wild-type DNA (bottom) by utilizing sequence-specific fluorescent PCR probes. In this approach, primers are specific to the sequence flanking the region of interest while each fluorescent probe has a sequence complementary to either the mutated strand (red) or the wild-type strand (blue). DNA is depicted by two horizontal lines connected by small vertical lines with the three central base pairs indicating the sequence of interest. Red letters indicated mutated single-nucleotide variant. B) dPCR can be used to identify copy-number alterations by comparing the number of PCR reactions from the target gene to the number of PCR reactions from a reference gene. Top, DNA originating from normal tissue contains two copies of the reference gene (blue DNA) and two copies of the target gene (green DNA) and results in two droplets containing reference gene PCR product (blue circle) and two droplets containing the target gene product (green circles). Bottom, DNA originating from tumor has an amplification of the target gene (green DNA) resulting in more droplets with PCR product from the target gene (green circles) compared to the number of droplets with reference gene (blue circle). C) The EWSR1/FLI1 translocation breakpoints occur at intronic regions of each gene and are patient specific. Top, intronic regions of EWSR1 and FLI1 with patient-specific breakpoints indicated for hypothetical patients 1 through 3. Bottom, rearranged DNA from patient 2 is shown with the breakpoint indicated by a vertical dotted red line. Short fragments of cell-free DNA from patient 2 align to the same genomic region as the translocation. Only patient-specific primers designed for patient 2 (red) can successfully result in a PCR product. PCR primers are depicted as arrows and the color is specific to primers designed to amplify the matched patient-specific translocation D) Top, next-generation sequencing reads are generated from cell-free DNA. Bottom, reads are then aligned to the reference genome. Mutated DNA has a sequence mismatch at the site of the somatic single-nucleotide variant indicated by the letter “C” in blue. E) Average coverage and aligned sequencing reads for a reference gene (left) and the target gene (right). Amplification of the target gene results in many more sequencing reads compared to the reference gene. F) Using a hybrid-capture sequencing panel designed to enrich sequencing reads for the intronic region of EWSR1, DNA translocations are identified as reads that map on one side to the EWSR1 intron and on the other side map to the FLI1 intron. Two red rectangles represent the two sides of a single sequencing read.
Figure 3.
Figure 3.. Relationship between sequencing depth and DNA coverage for next-generation sequencing.
The graph assumes that a fixed number of sequencing reads are generated for each sequencing strategy. As the targeted region increases (left to right), the depth of coverage decreases. These changes in depth can be overcome by increasing the number of sequencing reads generated, but that also results in a significant increase in cost.
Figure 4.
Figure 4.. Potential workflow for clinical application of different ctDNA assays.
This graph depicts one potential strategy to combine complementary technologies to detect, quantify, and profile ctDNA throughout the course of a patient’s care. At diagnosis and early in therapy, focused NGS assays can be used to detect and quantify ctDNA without requiring existing genomic data from the tumor (blue arrows). Highly-sensitive patient-specific assays can be developed for use later in therapy to detect minimal residual disease and for surveillance (green arrows). Broad genomic profiling can performed on ctDNA at relapse or progression (red arrows) and compared to broad profiling of the initial diagnostic sample (red asterisk) to identify patterns of tumor evolution, treatment resistance, and identify new targetable variants for clinical trial enrollment. Dollar signs indicate relative cost of each approach. The black line indicates ctDNA levels in the patient throughout the course of treatment.

References

    1. Mandel P, METAIS P. Comptes rendus des seances de la Societe de biologie et de ses filiales. 1948;142(3-4):241–243. - PubMed
    1. Leon SA, Shapiro B, Sklaroff DM, Yaros MJ. Free DNA in the Serum of Cancer Patients and the Effect of Therapy. Cancer Research. 1977;37(3):646–650. - PubMed
    1. Stroun M, Anker P, Lyautey J, Lederrey C, Maurice PA. Isolation and characterization of DNA from the plasma of cancer patients. European Journal of Cancer and Clinical Oncology. 1987;23(6):707–712. doi: 10.1016/0277-5379(87)90266-5 - DOI - PubMed
    1. Bettegowda C, Sausen M, Leary RJ, et al. Detection of circulating tumor DNA in early- and late-stage human malignancies. Science translational medicine. 2014;6(224):224ra24. doi: 10.1126/scitranslmed.3007094 - DOI - PMC - PubMed
    1. Dawson S-J, Tsui DWY, Murtaza M, et al. Analysis of circulating tumor DNA to monitor metastatic breast cancer. The New England journal of medicine. 2013;368(13):1199–1209. doi: 10.1056/NEJMoa1213261 - DOI - PubMed

Publication types