. 2019 Jan 7;17(1):e3000100.
doi: 10.1371/journal.pbio.3000100. eCollection 2019 Jan.

A transient helix in the disordered region of dynein light intermediate chain links the motor to structurally diverse adaptors for cargo transport

Affiliations

A transient helix in the disordered region of dynein light intermediate chain links the motor to structurally diverse adaptors for cargo transport

Ricardo Celestino et al. PLoS Biol. .

Abstract

All animal cells use the motor cytoplasmic dynein 1 (dynein) to transport diverse cargo toward microtubule minus ends and to organize and position microtubule arrays such as the mitotic spindle. Cargo-specific adaptors engage with dynein to recruit and activate the motor, but the molecular mechanisms remain incompletely understood. Here, we use structural and dynamic nuclear magnetic resonance (NMR) analysis to demonstrate that the C-terminal region of human dynein light intermediate chain 1 (LIC1) is intrinsically disordered and contains two short conserved segments with helical propensity. NMR titration experiments reveal that the first helical segment (helix 1) constitutes the main interaction site for the adaptors Spindly (SPDL1), bicaudal D homolog 2 (BICD2), and Hook homolog 3 (HOOK3). In vitro binding assays show that helix 1, but not helix 2, is essential in both LIC1 and LIC2 for binding to SPDL1, BICD2, HOOK3, RAB-interacting lysosomal protein (RILP), RAB11 family-interacting protein 3 (RAB11FIP3), ninein (NIN), and trafficking kinesin-binding protein 1 (TRAK1). Helix 1 is sufficient to bind RILP, whereas other adaptors require additional segments preceding helix 1 for efficient binding. Point mutations in the C-terminal helix 1 of Caenorhabditis elegans LIC, introduced by genome editing, severely affect development, locomotion, and life span of the animal and disrupt the distribution and transport kinetics of membrane cargo in axons of mechanosensory neurons, identical to what is observed when the entire LIC C-terminal region is deleted. Deletion of the C-terminal helix 2 delays dynein-dependent spindle positioning in the one-cell embryo but overall does not significantly perturb dynein function. We conclude that helix 1 in the intrinsically disordered region of LIC provides a conserved link between dynein and structurally diverse cargo adaptor families that is critical for dynein function in vivo.


Conflict of interest statement

The authors have declared that no competing interests exist.

Figures
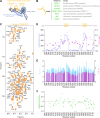
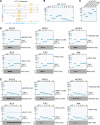
Fig 1
Fig 1. LIC1(388–523) is intrinsically disordered and contains two short segments with α-helical propensity.
(A) Subunit composition of dynein. The N-terminal RAS-like domain of the LIC binds to the N-terminal tail of the HC, and the flexible LIC C-terminal region interacts with cargo adaptor proteins, as illustrated in (B). (B) Cargo adaptor proteins examined in this study that bind the C-terminal region of dynein LIC. (C) 15N-1H HSQC spectrum of human LIC1(388–523) with backbone NH assignments. The spectra were acquired at 25°C and 900 MHz. Labels marked with an asterisk indicate peaks with heights below the cutoff contour level. (D) SSP scores for LIC1(388–523) calculated using 1HN, 15N, CO, CA, and CB chemical shifts for each assigned residue. “+1” indicates a fully formed α helix, “-1” indicates a fully formed β sheet, and “0” indicates disorder. GOR4 helix prediction scores are also shown. Values from 0 to 1,000 reflect absence of a fully formed α-helical structure. Scores obtained for residues 442–453 and 493–502 indicate transient α helix formation. (E) 15N relaxation measurements for LIC1(388–523). R1 and R2 relaxation rate constants at 700 MHz are shown for each assigned residue. (F) 15N-1H heteronuclear NOEs of LIC1(388–523) probing amide bond vector motion. Relaxation rate constants (E) and NOEs (F) are indicative of intrinsic structural disorder, and larger values indicate more restricted sub-nanosecond motion, which are observed for the helical regions. Underlying data for Fig 1 can be found in S1 Data. BICD2, bicaudal D homolog 2; dynein, cytoplasmic dynein 1; HC, heavy chain; HOOK3, Hook homolog 3; HSQC, heteronuclear single quantum coherence; LIC, light intermediate chain; MIRO, mitochondrial Rho; NIN, ninein; NOE, nuclear Overhauser enhancement; ppm, parts per million; RAB11FIP3, RAB11 family-interacting protein 3; RILP, RAB-interacting lysosomal protein; RZZ, ROD-ZW10-ZWILCH; SPDL1, Spindly; SSP, secondary structure propensity; TRAK1, trafficking kinesin-binding protein 1.
Fig 2
Fig 2. The LIC1(388–523) interaction with the N-terminal regions of SPDL1, BICD2, and HOOK3 at single-residue resolution.
(A) Overlay of NMR 15N-1H HSQC spectra of free 15N-labeled LIC1(388–523) (orange) and in a 1:1 mixture with unlabeled SPDL1(2–359) (blue). (B–D) Relative peak intensity quenching in the 15N-1H HSQC spectra of 15N-labeled LIC1(388–523) upon 1:1 titration of unlabeled SPDL1(2–359) (B), BICD2(2–422) (C), and HOOK3(2–239) (D). Gray bars indicate residues for which no ratio could be obtained because of peak overlap or because they were proline residues. (E–G) SPR sensograms from injection of dilution series of SPDL1(2–359) (E), BICD2(2–422) (F), and HOOK3(2–239) (G) over immobilized LIC1(388–523). Fitted KD values are indicated as mean ± SEM. Underlying data for Fig 2 can be found in S1 Data. BICD2, bicaudal D homolog 2; HOOK3, Hook homolog 3; HSQC, heteronuclear single quantum coherence; LIC1, light intermediate chain 1; NMR, nuclear magnetic resonance; ppm, parts per million; SPDL1, Spindly; SPR, surface plasmon resonance.
Fig 3
Fig 3. LIC1 C-terminal helix 1, but not helix 2, is essential for binding to structurally diverse adaptors.
(A) LIC1-C fragments used for binding assays. (B, C) Coomassie Blue–stained protein gels of purified GST::LIC1-C fragments (B) and purified N-terminal or full-length versions of adaptors (C) (also see S1B Fig). All adaptors contain a C-terminal Strep-tag II. (D, E) GST pull-downs using the proteins shown in (B) and (C). Protein fractions bound to beads were visualized on gels by Coomassie Blue staining and by immunoblot against the Strep-tag II. Molecular mass is indicated in kDa on the left. Each pull-down was performed at least three times. BICD2, bicaudal D homolog 2; FIP3, RAB11 family-interacting protein 3; GST, glutathione S-transferase; HOOK3, Hook homolog 3; LIC1-C, C-terminal light intermediate chain 1; NIN, ninein; ppm, parts per million; RILP, RAB-interacting lysosomal protein; SPDL1, Spindly.
Fig 4
Fig 4. LIC2 also uses its C-terminal helix 1 for binding to adaptors.
(A) LIC2-C fragments used for binding assays. (B) Coomassie Blue–stained protein gel of purified GST::LIC2-C fragments. (C) GST pull-downs using LIC2-C fragments shown in (B) and the Strep II–tagged adaptors shown in Fig 3C. Protein fractions bound to beads were visualized on gels by Coomassie Blue staining and by immunoblot against the Strep-tag II. Molecular mass is indicated in kDa on the left. Each pull-down was performed at least three times. BICD2, bicaudal D homolog 2; FIP3, RAB11 family-interacting protein 3; GST, glutathione S-transferase; HOOK3, Hook homolog 3; LIC2-C, C-terminal light intermediate chain 2; NIN, ninein; ppm, parts per million; RILP, RAB-interacting lysosomal protein; SPDL1, Spindly.
Fig 5
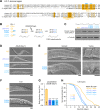
Fig 5. Point mutations in the C-terminal helix 1 of C. elegans DLI-1 cause severe developmental defects, impair locomotion, and shorten life span.
(A) C-terminal sequence alignment of the two human LIC paralogs and the sole LIC ortholog in C. elegans, DLI-1, showing high conservation of helix 1. Residues mutated to alanine are marked by asterisks. (B) (left) Cartoon showing DLI-1 WT and mutant versions (Δ369–443, F392A/F393A, or L396A/L397A) expressed in animals after CRISPR/Cas9-mediated genome editing. (right) Genetics of dli-1 mutant alleles. Mothers heterozygous for the mutant dli-1 allele contain a balancer chromosome with a WT copy, dli-1(wt). Progeny homozygous for the mutant dli-1 allele develop to adulthood but are sterile. All three dli-1 mutants behave the same. (C) Immunoblot showing levels of DHC-1 in adults of dli-1 mutants. α-Tubulin is used as a loading control. Also see S7 Fig. (D–F) Differential interference contrast images of animals at the day 1 adult stage, showing extensive morphological defects in dli-1 mutants. Scale bars: (D) 100 μm; (E) and (F) 20 μm. (G) Locomotion of day 1 adult animals, assessed by determining body bending frequency in liquid medium. Graph shows mean ± SEM for n number of animals from two independent experiments. Statistical significance (mutant versus WT dli-1) was determined by one-way ANOVA on ranks (Kruskal-Wallis nonparametric test) followed by Dunn’s multiple comparison test. ****P < 0.0001. (H) Life span curves. Animals were collected as L4 larvae (day 0) and observed every 1–3 d until they died. Mean life span (± SEM) is indicated for n number of animals. Underlying data for Fig 5 can be found in S1 Data. CRISPR/Cas9, clustered regularly interspaced short palindromic repeat/CRISPR-associated 9; DHC-1, dynein heavy chain 1; DLI-1, dynein LIC 1; LIC, light intermediate chain; WT, wild type.
Fig 6
Fig 6. C-terminal dli-1 mutations disrupt retrograde axonal transport of early endosomes.
(A) Cartoon showing the architecture of anterior touch receptor neurons. Animals coexpress mKate2::RAB-5, a marker for early endosomes, and soluble GFP in touch receptor neurons. ALM and AVM are neurons that extend processes into the nose and the nerve ring. Results shown in (B–I) derive from imaging specific regions in these neurons, as indicated. (B, C) Fluorescence images of axonal tips (B) and nerve rings (C) in day 1 adults, showing misaccumulation of early endosomes in dli-1 mutants. Scale bars, 10 μm. (D, E) Quantification of early endosome misaccumulation in axonal tips (D) and nerve rings (E), using fluorescence intensity measurements of mKate2::RAB-5 in images as shown in (B) and (C), respectively. Graphs represent the mean ± SEM signal in A.U. for n number of neurons imaged in two independent experiments. Statistical significance (mutant versus WT dli-1) was determined by one-way ANOVA on ranks (Kruskal-Wallis nonparametric test) followed by Dunn’s multiple comparison test. ****P < 0.0001. Also see S1 Movie. (F) Kymographs of mKate2::RAB-5-labeled early endosome motility in axons of ALM neurons, imaged at the L4 larval stage. Time-lapse sequences of confocal images were recorded every 200 ms in an axonal region approximately 50 μm away from the cell body, which is positioned to the right. Scale bar, 10 μm. (G–I) Quantification of early endosome motility, based on the analysis of kymographs as shown in (F). Graphs represent the mean ± SEM. For (G), n is the total number of axons. For (H) and (I), n is the total number of segments within tracks of moving particles framed by a pause or a reversal. Results are derived from 2–5 independent imaging sessions. Statistical significance was determined as described for (D, E). ****P < 0.0001; ***P < 0.001; ns indicates P > 0.05. Also see S8A Fig. Underlying data for Fig 6 can be found in S1 Data. ALM, anterior lateral mechanosensory; A.U., arbitrary units; AVM, anterior ventral mechanosensory; GFP, green fluorescent protein; ns, not significant; WT, wild type.
Fig 7
Fig 7. C-terminal dli-1 mutants have increased numbers of mitochondria that move with reduced retrograde velocity.
(A) Cartoon highlighting the axons of ALM neurons examined in (B–G). Animals coexpress TOMM-20(1–54)::mKate2, a marker for mitochondria, and soluble GFP in these neurons. (B) Fluorescence images of ALM axons in animals at the day 1 adult stage. Blow-ups highlight the prevalence of small (<1 μm) TOMM-20(1–54)::mKate2 puncta in the dli-1(L396A/L397A) mutant. Scale bars, 10 μm; blow-ups, 2.5 μm. (C, D) Total number of mitochondria per ALM axon (C) and axonal length (D) in day 1 adults. Graphs represent the mean ± SEM. Statistical significance (mutant versus WT dli-1) was determined by one-way ANOVA on ranks (Kruskal-Wallis nonparametric test) followed by Dunn’s multiple comparison test. ****P < 0.0001; ns indicates P > 0.05. (E) Relative distribution of mitochondria along the ALM axon from the proximal (0%) to the distal (100%) end in day 1 adults. Graph corresponds to the mean, and the number n of axons imaged for each condition is indicated. (F) Kymographs of mitochondrial motility in axons of ALM neurons, imaged at the L4 larval stage. Time-lapse sequences of confocal images were recorded every 5 s in an axonal region approximately 50 μm away from the cell body, which is positioned to the right. Scale bar, 10 μm. Also see S2 Movie. (G) Quantification of mitochondrial transport velocity, based on the analysis of kymographs as shown in (F). Graphs represent the mean ± SEM. n is the total number of segments within tracks of moving particles framed by a pause or a reversal. Results are derived from 5–8 independent imaging sessions. Statistical significance was determined as described for (C, D). ****P < 0.0001; ***P < 0.001. Also see S8E and S8F Fig. (H) Coomassie Blue–stained protein gel of purified GST-tagged human LIC1-C and purified MBP::TRAK1 fragments containing a C-terminal Strep-tag II (also see S1B Fig). Two different versions of the first coiled-coil segment of TRAK1 were fused to a fragment of the yeast transcriptional activator GCN4 for artificial dimerization. (I) GST pull-downs using the proteins shown in (H). Protein fractions bound to beads were visualized on gels by Coomassie Blue staining and by immunoblot against the Strep-tag II. Molecular mass is indicated in kDa on the left. Each pull-down was performed at least three times. Underlying data for Fig 7 can be found in S1 Data. ALM, anterior lateral mechanosensory; GCN4, general control nondepressible 4; GFP, green fluorescent protein; GST, glutathione S-transferase; LIC1-C, C-terminal light intermediate chain 1; MBP, maltose-binding protein; ns, not significant; TRAK1, trafficking kinesin-binding protein 1; WT, wild type.
Fig 8
Fig 8. Deletion of the C-terminal helix 2 in DLI-1 affects mitotic spindle positioning in the one-cell embryo.
(A) Sequence alignment of human and C. elegans LIC-C showing the deleted region in DLI-1 that includes the conserved helix 2. (B) Cartoon highlighting the axons of ALM neurons examined in (C) and (D). Animals coexpress mKate2::RAB-5 and soluble GFP in these neurons. (C) Fluorescence images of ALM axonal tips in day 1 adults. Scale bar, 10 μm. (D) Quantification of mKate2::RAB-5 levels at axonal tips, using fluorescence intensity measurements in images as shown in (C). Graph represents the mean ± SEM signal in A.U. for n number of neurons imaged in two independent experiments. Statistical significance (mutant versus WT dli-1) was determined with the Mann-Whitney test. ns indicates P > 0.05. (E) (top) Cartoon illustrating that animals homozygous for dli-1(Δ414–443) are viable and fertile. (bottom) Stills from time-lapse sequences in the one-cell embryo showing the delay in mitotic spindle orientation in dli-1(Δ414–443). Scale bar, 10 μm. (F) (top) Cartoon showing the angle (α) between the C-C axis and the A-P axis in one-cell embryos at NEBD. (bottom) Rose diagrams of angle α measured at NEBD in images as shown in (E). A significant fraction of dli-1(Δ414–443) embryos have a severely tilted C-C axis relative to controls (α > 45°; Fisher’s exact test, P = 0.029). Underlying data for Fig 8 can be found in S1 Data. ALM, anterior lateral mechanosensory; A-P, anterior–posterior; A.U., arbitrary units; C-C, centrosome–centrosome; DLI-1, dynein LIC 1; GFP, green fluorescent protein; LIC, light intermediate chain; LIC-C, C-terminal LIC; NEBD, nuclear envelope breakdown; ns, not significant; WT, wild type.

Similar articles

Cited by

References

    1. Lipka J, Kuijpers M, Jaworski J, Hoogenraad CC. Mutations in cytoplasmic dynein and its regulators cause malformations of cortical development and neurodegenerative diseases. Biochem Soc Trans. 2013; 41(6):1605–12. 10.1042/BST20130188 - DOI - PubMed
    1. Franker MA, Hoogenraad CC. Microtubule-based transport—basic mechanisms, traffic rules and role in neurological pathogenesis. J Cell Sci. 2013; 126(11):2319–29. 10.1242/jcs.115030 - DOI - PubMed
    1. Urnavicius L, Zhang K, Diamant AG, Motz C, Schlager MA, Yu M, et al. The structure of the dynactin complex and its interaction with dynein. Science. 2015; 347(6229):1441–46. 10.1126/science.aaa4080 - DOI - PMC - PubMed
    1. Reck-Peterson SL, Redwine WB, Vale RD, Carter AP. The cytoplasmic dynein transport machinery and its many cargoes. Nat Rev Mol Cell Biol. 2018; 19(6):382–98. 10.1038/s41580-018-0004-3 - DOI - PMC - PubMed
    1. Splinter D, Razafsky DS, Schlager MA, Serra-Marques A, Grigoriev I, Demmers J, et al. BICD2, dynactin, and LIS1 cooperate in regulating dynein recruitment to cellular structures. Mol Biol Cell. 2012; 23(21):4226–41. 10.1091/mbc.E12-03-0210 - DOI - PMC - PubMed

Publication types

MeSH terms

LinkOut - more resources