

A pan-transcriptome analysis shows that disease resistance genes have undergone more selection pressure during barley domestication
- PMID: 30616511
- PMCID: PMC6323845
- DOI: 10.1186/s12864-018-5357-7
A pan-transcriptome analysis shows that disease resistance genes have undergone more selection pressure during barley domestication
Abstract
Background: It has become clear in recent years that many genes in a given species may not be found in a single genotype thus using sequences from a single genotype as reference may not be adequate for various applications.
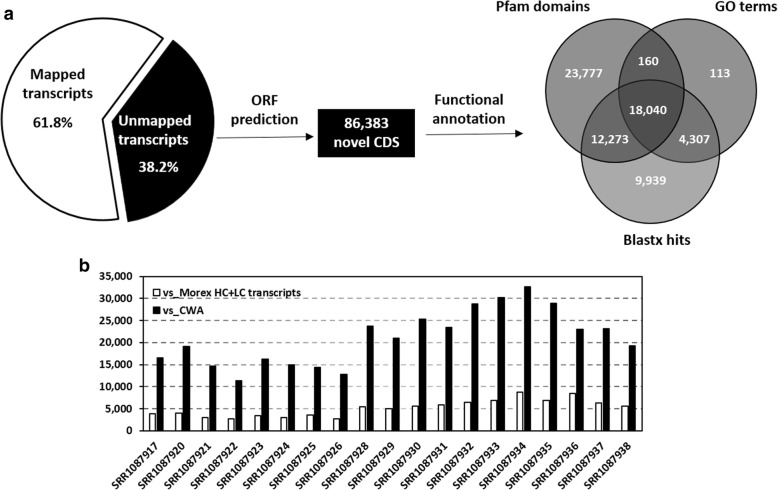
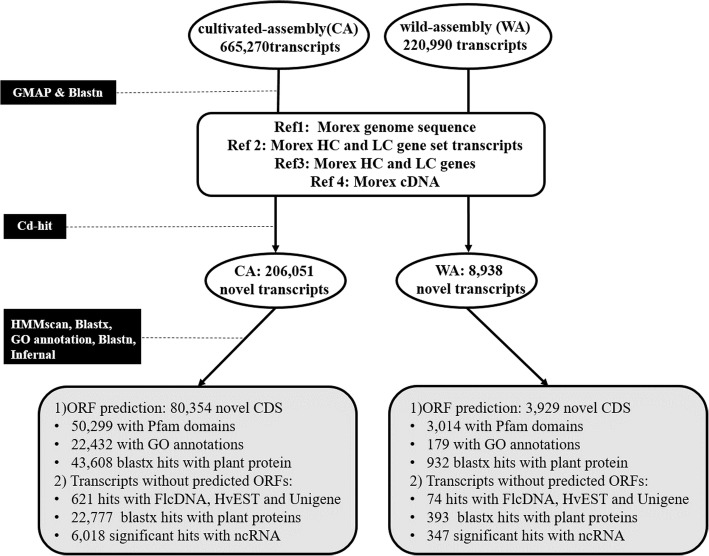
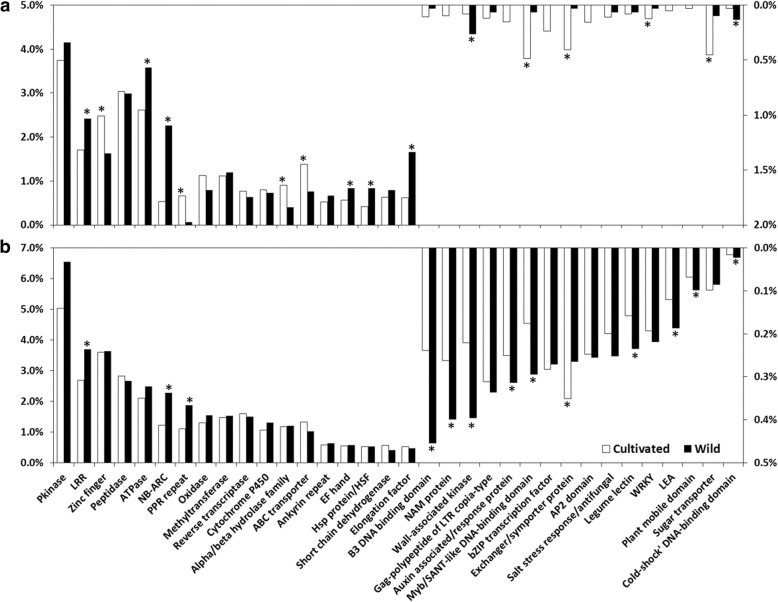
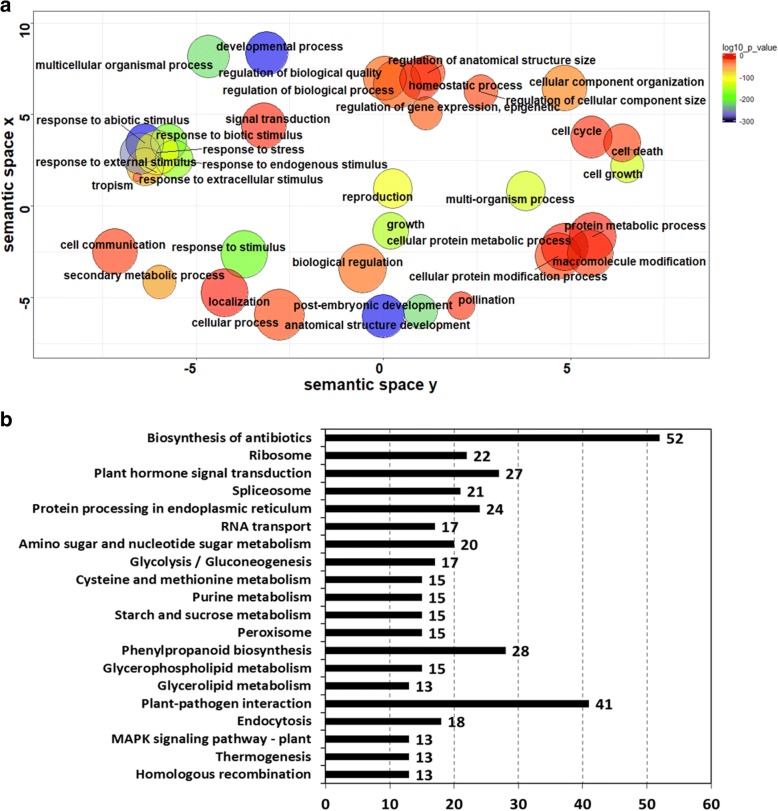
Results: In this study we constructed a pan-transcriptome for barley by de novo assembling 288 sets of RNA-seq data from 32 cultivated barley genotypes and 31 wild barley genotypes. The pan-transcriptome consists of 756,632 transcripts with an average N50 length of 1240 bp. Of these, 289,697 (38.2%) were not found in the genome of the international reference genotype Morex. The novel transcripts are enriched with genes associated with responses to different stresses and stimuli. At the pan-transcriptome level, genotypes of wild barley have a higher proportion of disease resistance genes than cultivated ones.
Conclusions: We demonstrate that the use of the pan-transcriptome dramatically improved the efficiency in detecting variation in barley. Analysing the pan-transcriptome also found that, compared with those in other categories, disease resistance genes have gone through stronger selective pressures during domestication.
Keywords: Barley; Cultivated; Novel transcripts; Pan-transcriptome; Resistance; Wild.
Conflict of interest statement
Ethics approval and consent to participate
Not applicable.
Consent for publication
Not applicable.
Competing interests
The authors declare that they have no competing interests.
Publisher’s Note
Springer Nature remains neutral with regard to jurisdictional claims in published maps and institutional affiliations.
Figures
Similar articles
-
The draft genome of a wild barley genotype reveals its enrichment in genes related to biotic and abiotic stresses compared to cultivated barley.Plant Biotechnol J. 2020 Feb;18(2):443-456. doi: 10.1111/pbi.13210. Epub 2019 Aug 4. Plant Biotechnol J. 2020. PMID: 31314154 Free PMC article.
-
Transcriptome profiling reveals mosaic genomic origins of modern cultivated barley.Proc Natl Acad Sci U S A. 2014 Sep 16;111(37):13403-8. doi: 10.1073/pnas.1414335111. Epub 2014 Sep 2. Proc Natl Acad Sci U S A. 2014. PMID: 25197090 Free PMC article.
-
Population-based resequencing analysis of wild and cultivated barley revealed weak domestication signal of selection and bottleneck in the Rrs2 scald resistance gene region.Genome. 2012 Feb;55(2):93-104. doi: 10.1139/g11-082. Epub 2012 Jan 24. Genome. 2012. PMID: 22272833
-
The importance of barley genetics and domestication in a global perspective.Ann Bot. 2007 Nov;100(5):999-1008. doi: 10.1093/aob/mcm139. Epub 2007 Aug 30. Ann Bot. 2007. PMID: 17761690 Free PMC article. Review.
-
Prospects of pan-genomics in barley.Theor Appl Genet. 2019 Mar;132(3):785-796. doi: 10.1007/s00122-018-3234-z. Epub 2018 Nov 16. Theor Appl Genet. 2019. PMID: 30446793 Review.
Cited by
-
A barley pan-transcriptome reveals layers of genotype-dependent transcriptional complexity.Nat Genet. 2025 Feb;57(2):441-450. doi: 10.1038/s41588-024-02069-y. Epub 2025 Feb 3. Nat Genet. 2025. PMID: 39901014 Free PMC article.
-
Understanding the Plant-microbe Interactions in CRISPR/CAS9 Era: Indeed a Sprinting Start in Marathon.Curr Genomics. 2020 Sep;21(6):429-443. doi: 10.2174/1389202921999200716110853. Curr Genomics. 2020. PMID: 33093805 Free PMC article. Review.
-
Genetic variation of HvXYN1 associated with endoxylanase activity and TAX content in barley (Hordeum vulgare L.).BMC Plant Biol. 2019 Apr 30;19(1):170. doi: 10.1186/s12870-019-1747-5. BMC Plant Biol. 2019. PMID: 31039733 Free PMC article.
-
Variation in Recombination Rate Is Shaped by Domestication and Environmental Conditions in Barley.Mol Biol Evol. 2019 Sep 1;36(9):2029-2039. doi: 10.1093/molbev/msz141. Mol Biol Evol. 2019. PMID: 31209472 Free PMC article.
-
Transcriptome profiling of barley in response to mineral and organic fertilizers.BMC Plant Biol. 2023 May 16;23(1):261. doi: 10.1186/s12870-023-04263-2. BMC Plant Biol. 2023. PMID: 37193945 Free PMC article.
References
MeSH terms
Grants and funding
LinkOut - more resources
Full Text Sources
