. 2019 Jan 7;19(1):11.
doi: 10.1186/s12870-018-1589-6.

Genome-wide dynamic network analysis reveals a critical transition state of flower development in Arabidopsis

Affiliations

Genome-wide dynamic network analysis reveals a critical transition state of flower development in Arabidopsis

Fuping Zhang et al. BMC Plant Biol. .

Abstract

Background: The flowering transition which is controlled by a complex and intricate gene regulatory network plays an important role in the reproduction for offspring of plants. It is a challenge to identify the critical transition state as well as the genes that control the transition of flower development. With the emergence of massively parallel sequencing, a great number of time-course transcriptome data greatly facilitate the exploration of the developmental phase transition in plants. Although some network-based bioinformatics analyses attempted to identify the genes that control the phase transition, they generally overlooked the dynamics of regulation and resulted in unreliable results. In addition, the results of these methods cannot be self-explained.

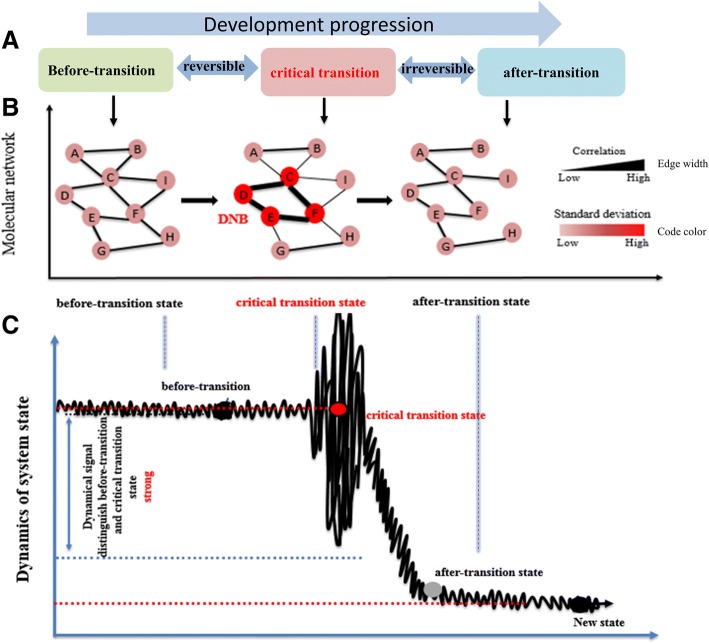
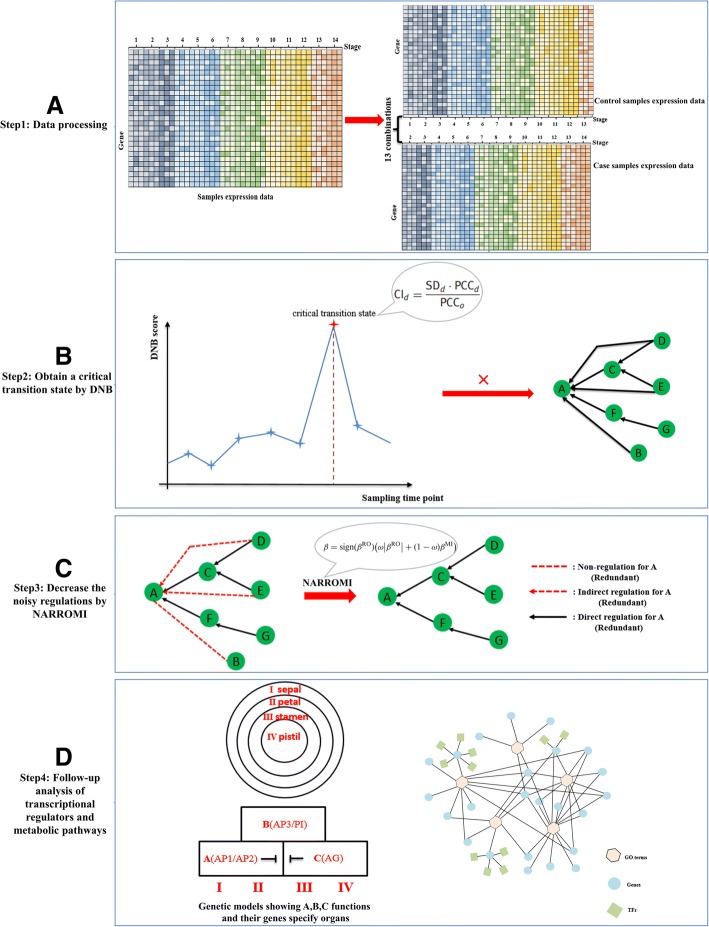
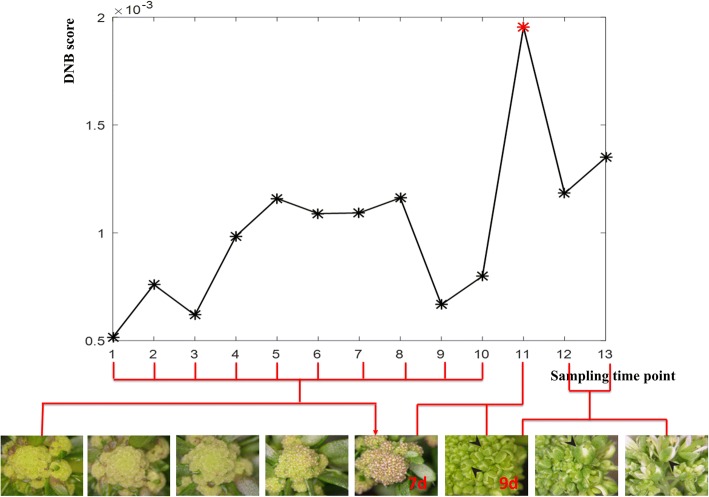
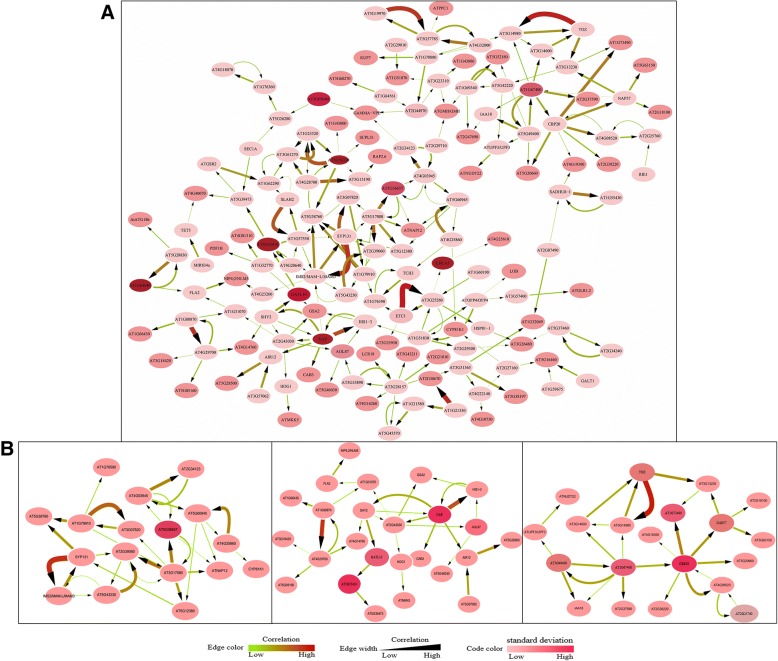
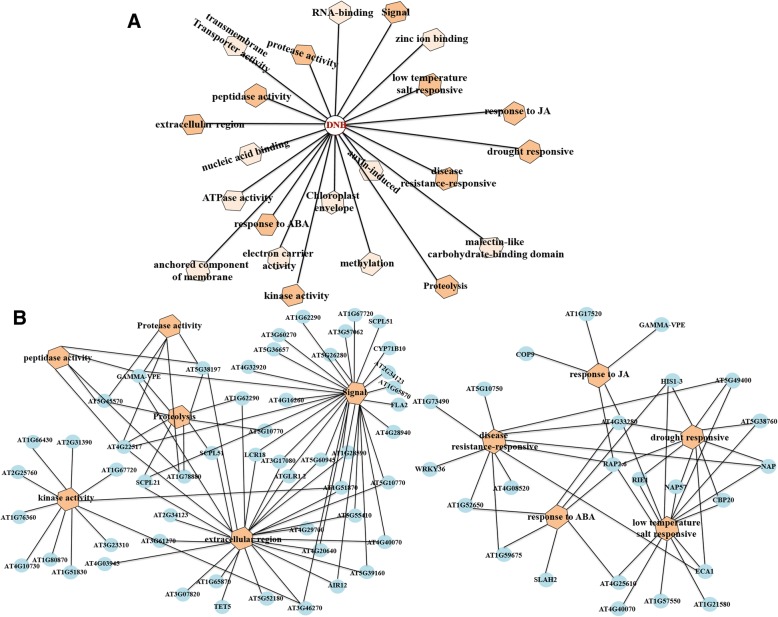
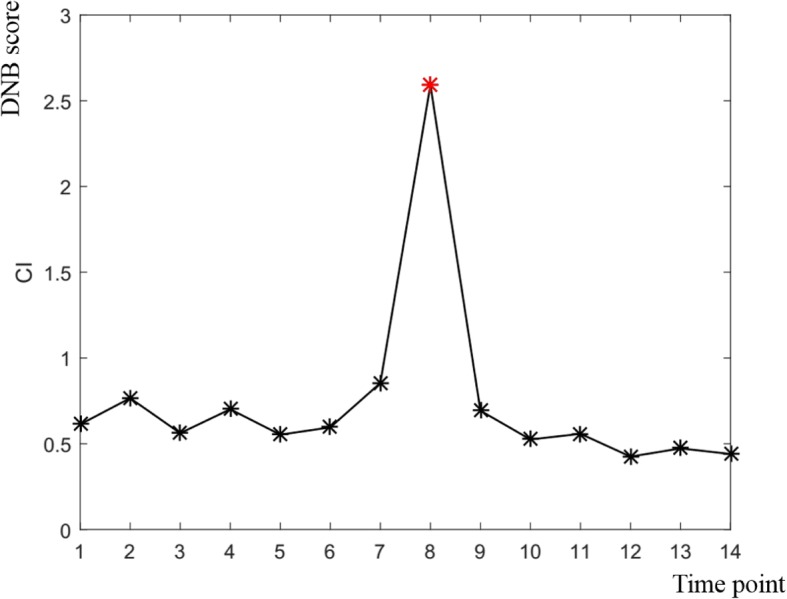
Results: In this work, to reveal a critical transition state and identify the transition-specific genes of flower development, we implemented a genome-wide dynamic network analysis on temporal gene expression data in Arabidopsis by dynamic network biomarker (DNB) method. In the analysis, DNB model which can exploit collective fluctuations and correlations of different metabolites at a network level was used to detect the imminent critical transition state or the tipping point. The genes that control the phase transition can be identified by the difference of weighted correlations between the genes interested and the other genes in the global network. To construct the gene regulatory network controlling the flowering transition, we applied NARROMI algorithm which can reduce the noisy, redundant and indirect regulations on the expression data of the transition-specific genes. In the results, the critical transition state detected during the formation of flowers corresponded to the development of flowering on the 7th to 9th day in Arabidopsis. Among of 233 genes identified to be highly fluctuated at the transition state, a high percentage of genes with maximum expression in pollen was detected, and 24 genes were validated to participate in stress reaction process, as well as other floral-related pathways. Composed of three major subnetworks, a gene regulatory network with 150 nodes and 225 edges was found to be highly correlated with flowering transition. The gene ontology (GO) annotation of pathway enrichment analysis revealed that the identified genes are enriched in the catalytic activity, metabolic process and cellular process.

Conclusions: This study provides a novel insight to identify the real causality of the phase transition with genome-wide dynamic network analysis.

Keywords: Dynamical network biomarker (DNB); Flower development; Gene regulatory network (GRN); Phase transition; Time-course gene expression data.


Conflict of interest statement

Ethics approval and consent to participate

Not applicable.

Consent for publication

Not applicable.

Competing interests

The authors declare that they have no competing interests.

Publisher’s Note

Springer Nature remains neutral with regard to jurisdictional claims in published maps and institutional affiliations.

Figures

Fig. 1
Fig. 1
The outline representation of critical transition state by DNB based on time-series gene expression data. a The progression of Arabidopsis flower development from the time of initiation to maturation can be divided into three states, i.e., the before-transition state, the critical transition state, and the after-transition state. A system at the before-transition state or the after-transition state is stable with high resilience. b In the critical transition state, deviations of the DNB members increase drastically, and the correlation between any two molecules increases. This critical phenomenon does not appear at the before-transition and the after-transition states. c The DNB members show large fluctuations in their expressions at the critical transition state, compared with smaller fluctuations of the expressions at the before- or after- transition states
Fig. 2
Fig. 2
The flow diagram for revealing the critical transition state. a With samples in previous and the current time points designated as the control and case sample respectively. The 14 different developmental stages from initial to mature were divided into 13 combinations. b We applied DNB method to reveal a critical differentiation state of Arabidopsis flower development by comparing the control and case samples. c To construct the gene regulatory network controlling the flowering transition, we applied NARROMI algorithm on the expression data of the transition-specific genes. The NARROMI algorithm removes noisy regulations with low pair-wise correlations and redundant regulations from indirect regulators using ordinary differential equation-based recursive optimization (RO) and information theory-based mutual information (MI), respectively. The dotted line without arrowhead denotes non-regulation (redundant), the dotted arrow denotes the indirect regulation (redundant) and the solid arrow denotes the true regulation. d We also analyzed key regulatory factors and key metabolic pathways which were closely related to the phase transition of Arabidopsis flowering development from the time of initiation to maturation time
Fig. 3
Fig. 3
Identification of the critical transition state of flower development in Arabidopsis thaliana. The DNB scores at 13 sampling time points is shown in the FIGURE. For the black curve, the DNB score increased sharply from the 10th point and reached the peak at the 11th point. The 11th sampling time point annotated by the red star is designated as a critical transition state, which corresponds to the comparison of growth on the 7th to 9th day of Arabidopsis flower development
Fig. 4
Fig. 4
DNB members and correlations among these molecules were visualized in molecular networks by using Cytoscape. Node color reflects the standard deviation of the corresponding genes. The strength of correlations is represented by edge width, where a wider edge corresponds to a higher correlation. For clarity, the strength of correlations was also reflected by edge color. a A more reliable co-expression gene regulatory network of the Arabidopsis floral transition. b Three key subnetworks in DNB given separately
Fig. 5
Fig. 5
GO terms function enrichment analysis of DNB members. a biological process, (b) cellular component, (c) molecular function. The p-values are plotted on a linear scale. The size of the dot is proportional with the number of annotated genes for the respective GO term and its coloring represents the number of significantly differentially expressed genes, with the dark red points having more genes then the yellow ones
Fig. 6
Fig. 6
Transcriptional modules predicted to regulate the floral transition. a There are a number of GO terms (orange hexagons) which are significantly overrepresented (P, 0.01) in the DNB module. b Several GO terms (orange hexagons) that are significantly overrepresented (P, 0.01) within the DNB module (circles) are shown together with co-expressed genes (light blue Circles)
Fig. 7
Fig. 7
Identification of the DNB of flower development in rice. The DNB scores at 14 sampling time points is shown in the FIGURE. For the black curve, the DNB score increased sharply from the 7th point and reached the peak at the 8th point. The 8th sampling time point annotated by the red star is designated as a critical transition state, which corresponds to the development of specific floral organs (anther and pistil) in rice

Similar articles

Cited by

References

    1. Rougvie AE. Intrinsic and extrinsic regulators of developmental timing: from miRNAs to nutritional cues. Development. 2005;132(17):3787–3798. doi: 10.1242/dev.01972. - DOI - PubMed
    1. Amasino R. Seasonal and developmental timing of flowering. Plant J. 2010;61(6):1001–1013. doi: 10.1111/j.1365-313X.2010.04148.x. - DOI - PubMed
    1. Kubota A, Kita S, Ishizaki K, Nishihama R, Yamato KT, Kohchi T. Co-option of a photoperiodic growth-phase transition system during land plant evolution. Nat Commun. 2014;5:3668. doi: 10.1038/ncomms4668. - DOI - PubMed
    1. Jia H, Suzuki M, McCarty DR. Regulation of the seed to seedling developmental phase transition by the LAFL and VAL transcription factor networks. Wiley Interdiscipl Rev Dev Biol. 2014;3(1):135–145. doi: 10.1002/wdev.126. - DOI - PMC - PubMed
    1. Moose SP, Sisco PH. Glossy15 controls the epidermal juvenile-to-adult phase transition in maize. Plant Cell. 1994;6(10):1343–1355. doi: 10.1105/tpc.6.10.1343. - DOI - PMC - PubMed

MeSH terms

Substances

LinkOut - more resources