. 2019 Jan 7;21(1):2.
doi: 10.1186/s13058-018-1089-5.

Molecular changes during extended neoadjuvant letrozole treatment of breast cancer: distinguishing acquired resistance from dormant tumours

Affiliations

Molecular changes during extended neoadjuvant letrozole treatment of breast cancer: distinguishing acquired resistance from dormant tumours

Cigdem Selli et al. Breast Cancer Res. .

Abstract

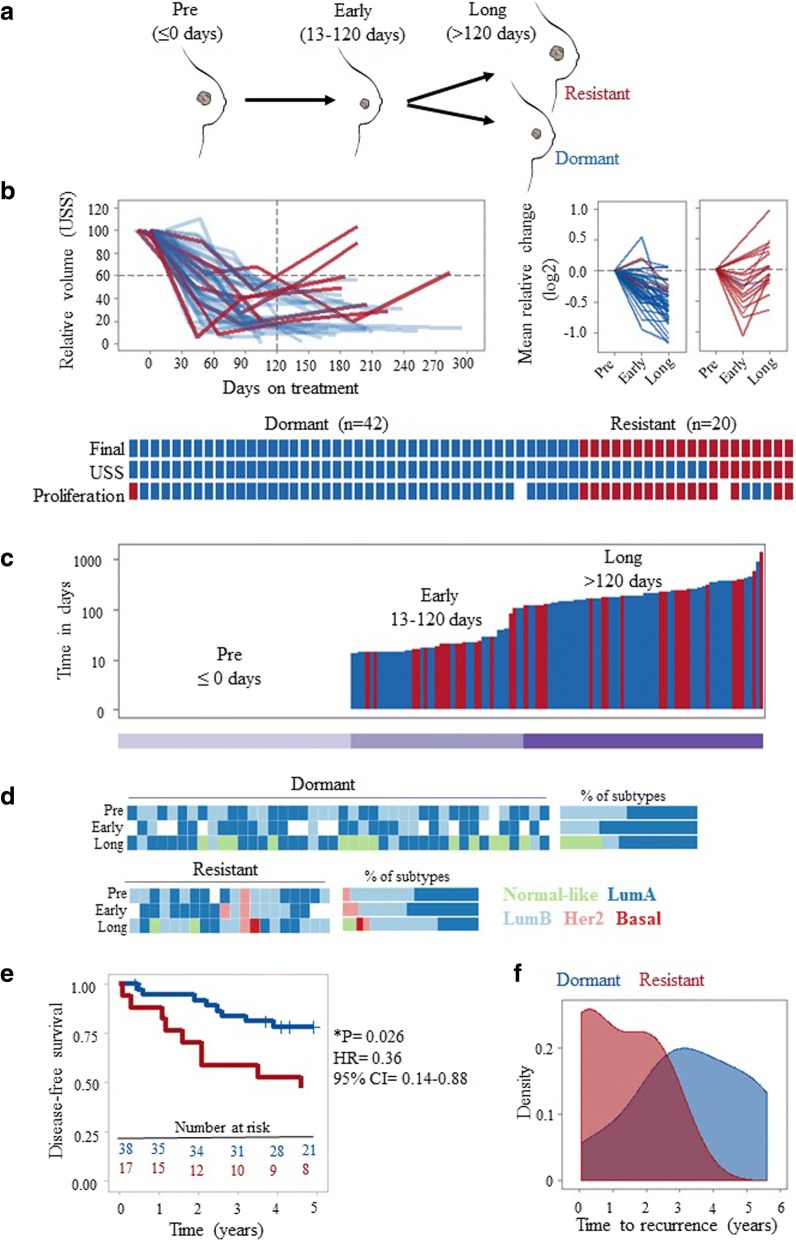
Background: The risk of recurrence for endocrine-treated breast cancer patients persists for many years or even decades following surgery and apparently successful adjuvant therapy. This period of dormancy and acquired resistance is inherently difficult to investigate; previous efforts have been limited to in-vitro or in-vivo approaches. In this study, sequential tumour samples from patients receiving extended neoadjuvant aromatase inhibitor therapy were characterised as a novel clinical model.

Methods: Consecutive tumour samples from 62 patients undergoing extended (4-45 months) neoadjuvant aromatase inhibitor therapy with letrozole were subjected to transcriptomic and proteomic analysis, representing before (≤ 0), early (13-120 days), and long-term (> 120 days) neoadjuvant aromatase inhibitor therapy with letrozole. Patients with at least a 40% initial reduction in tumour size by 4 months of treatment were included. Of these, 42 patients with no subsequent progression were classified as "dormant", and the remaining 20 patients as "acquired resistant".

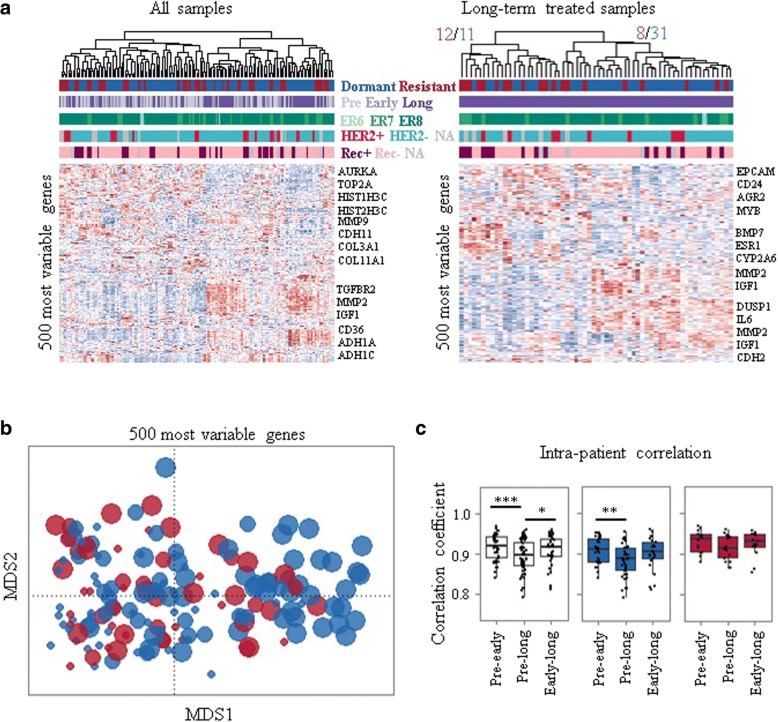
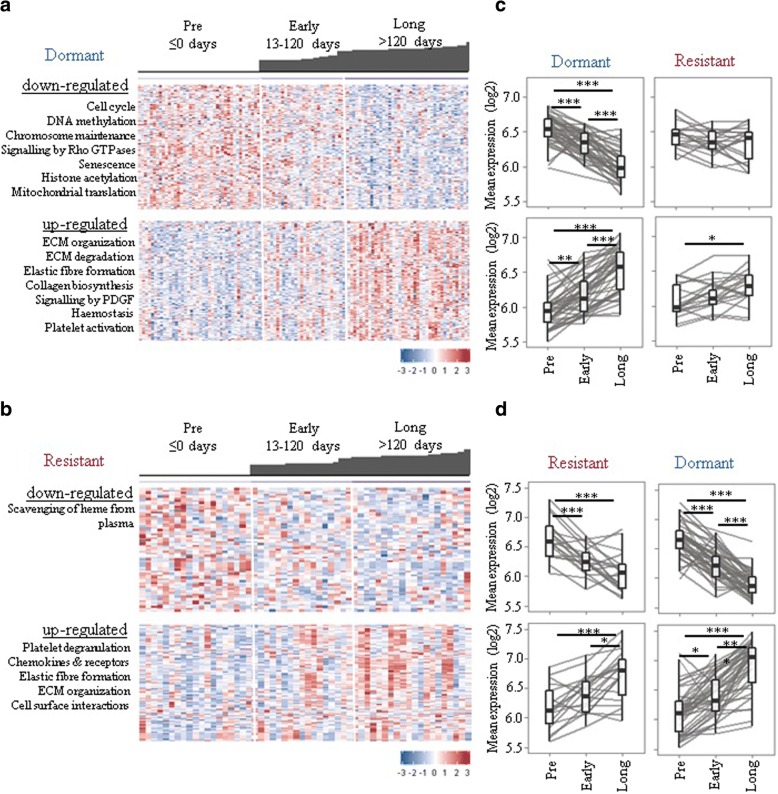
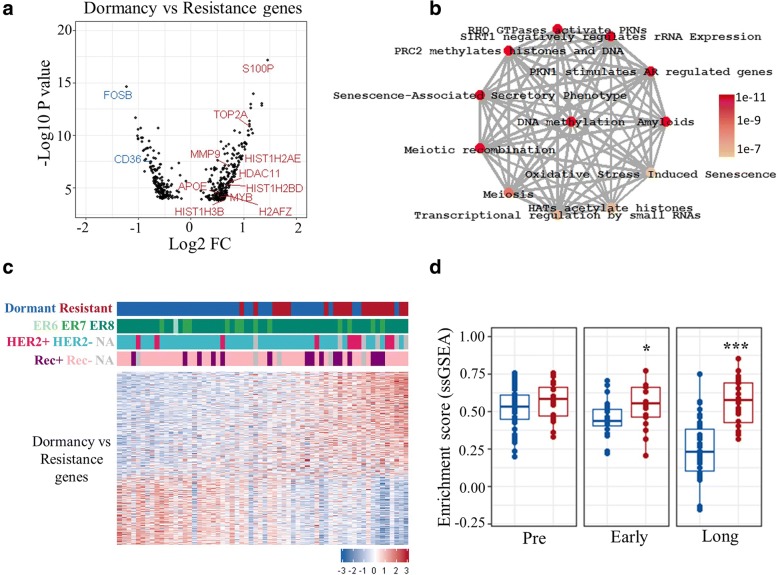
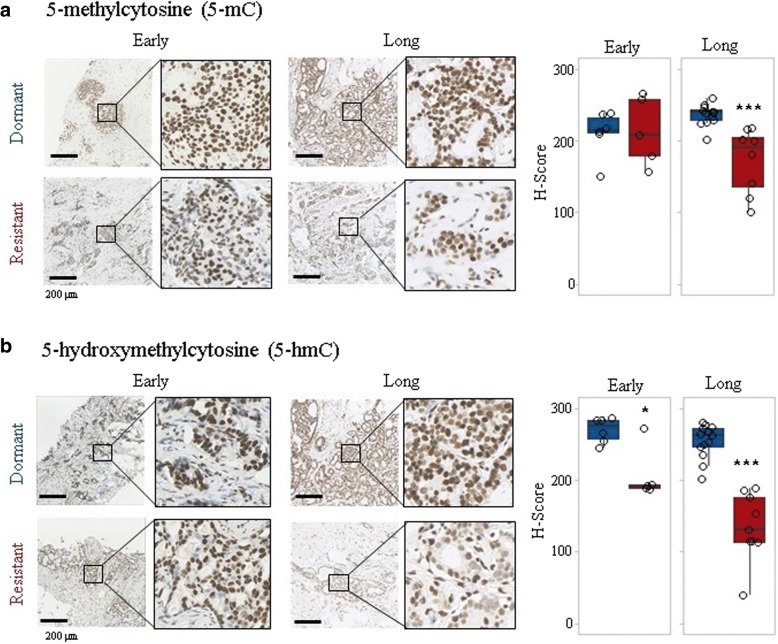
Results: Changes in gene expression in dormant tumours begin early and become more pronounced at later time points. Therapy-induced changes in resistant tumours were common features of treatment, rather than being specific to the resistant phenotype. Comparative analysis of long-term treated dormant and resistant tumours highlighted changes in epigenetics pathways including DNA methylation and histone acetylation. The DNA methylation marks 5-methylcytosine and 5-hydroxymethylcytosine were significantly reduced in resistant tumours compared with dormant tissues after extended letrozole treatment.

Conclusions: This is the first patient-matched gene expression study investigating long-term aromatase inhibitor-induced dormancy and acquired resistance in breast cancer. Dormant tumours continue to change during treatment whereas acquired resistant tumours more closely resemble their diagnostic samples. Global loss of DNA methylation was observed in resistant tumours under extended treatment. Epigenetic alterations may lead to escape from dormancy and drive acquired resistance in a subset of patients, supporting a potential role for therapy targeted at these epigenetic alterations in the management of resistance to oestrogen deprivation therapy.

Keywords: Dormancy; Epigenetics; Letrozole; Microarray; Oestrogen deprivation therapy; Proteomics; Resistance; Sequential samples.


Conflict of interest statement

Authors’ information

Not applicable.

Ethics approval and consent to participate

All patients provided informed consent and sample collection was approved by the local research ethics committee (Lothian Local Research Ethics Committee 03, REC Reference number 07/S1103/26, approval date 13 August 2007).

Consent for publication

Not applicable.

Competing interests

The authors declare that they have no competing interests.

Publisher’s Note

Springer Nature remains neutral with regard to jurisdictional claims in published maps and institutional affiliations.

Figures

Fig. 1
Fig. 1
Long-term oestrogen deprivation therapy as a clinical model to investigate breast cancer dormancy and acquired resistance. a Extended (4–45 months) letrozole treatment was exploited as a clinical model of breast cancer dormancy and acquired resistance. Sequential clinical samples from the same patient with no surgery and extended treatment were used to model clinical breast cancer dormancy and resistance. Before (pre, ≤ 0 days), early-on (early, 13–120 days) and long-term (long, > 120 days) neoadjuvant aromatase inhibitor therapy with letrozole. b Dynamic change in tumour size by ultrasound scan (USS) and mean expression of proliferation markers MKI67, PCNA, and MCM2 were used to classify patients into two categories: dormant (blue) and resistant (red). Overall comparisons of classifications per patient based on USS and mean change in proliferation markers with final classification are shown. c The duration of letrozole treatment (days) for samples from dormant (blue) and resistant (red) patients. Each bar represents a sample. Samples are ordered by time on treatment. d Intrinsic subtype classification by PAM50 of samples at each time point. Stacked bar graphs on the right show the percentage of each subtype of samples from dormant and resistant patients. e Kaplan-Meier plot showing disease-free survival probability in patients with dormant versus resistant tumours (log-rank test). Disease-free survival was defined from time of surgery. f Density plot showing the distribution of time to recurrence (in years; defined from time of surgery) in patients with dormant and resistant tumours. CI confidence interval, HR hazard ratio, LumA luminal A, LumB luminal B
Fig. 2
Fig. 2
Distinct transcriptomic changes during long-term aromatase inhibitor treatment. a Unsupervised hierarchical clustering with most variant 500 genes across all samples and long-term treated samples. ER6, ER7, ER8 correspond to oestrogen receptor (ER) Allred scores 6, 7, and 8, respectively. b Multidimensional scaling (MDS) plot using the 500 genes with the highest variance across all time points. Each dot corresponds to a sample and sizes represent the duration of treatment. c Intra-patient (comparison of samples from the same patient) correlations of transcriptome are shown. Dormant (blue); resistant (red); before (pre, ≤ 0 days), early-on (early, 13–120 days), and long-term (long, > 120 days) neoadjuvant aromatase inhibitor therapy with letrozole. ***p < 0.001; **p < 0.01; *p < 0.05. NA not available, Rec+ recurrence, Rec– recurrence free
Fig. 3
Fig. 3
Long-term oestrogen deprivation therapy is associated with cell cycle, senescence, epigenetic regulation, and extracellular matrix (ECM)-associated pathways. Differentially expressed genes between pre-treatment and long-term treated dormant (a) and resistant (b) tumours were determined. Heat-maps showing change in downregulated and upregulated gene expression in dormant (a) and resistant (b) samples. Each column represents a sample and each row a gene. Colours are log2 mean-centred values with red indicating high values and blue indicating low expression. Bar plots on top of heat-maps represent the time on treatment (days) for each sample. c,d Graphs show dynamic changes in mean expression of differentially expressed genes in response classes. ***p < 0.001; **p < 0.01; *p < 0.05
Fig. 4
Fig. 4
Comparative analysis of dormant and resistant tumours. a Volcano plot showing differentially expressed genes between long-term treated dormant and resistant tumours (dormancy versus resistance genes). Some upregulated and downregulated genes in resistant tumours are highlighted in red and blue, respectively. b Significantly enriched pathways for dormancy versus resistance genes (p < 0.01; ReactomePA). Grey edges connecting the nodes indicates genes shared between the nodes/pathways, and the width of the edge is scaled by the number of common genes. Colours indicates the significance (p value) where red is a lower p value. c Heatmap showing partial separation of long-term treated dormant and resistant samples using dormancy versus resistance genes (a total of 419; 170 downregulated and 249 upregulated genes). Colours are log2 mean-centred values with red indicating high and blue indicating low expression. Genes are sorted by fold-change (FC) values from most to least up/downregulated. Samples are sorted by sum expression of upregulated genes. ER6, ER7, and ER8 correspond to oestrogen receptor (ER) Allred scores 6, 7, and 8, respectively. d Comparison of single sample gene enrichment analysis (ssGSEA) scores of dormancy versus resistance upregulated genes between dormant and acquired resistant tumours. Dormant (blue); resistant (red); before (pre, ≤ 0 days), early-on (early, 13–120 days) and long-term (long, > 120 days) neoadjuvant aromatase inhibitor therapy with letrozole. ***p < 0.001; *p < 0.05. NA not available, Rec+ recurrence, Rec– recurrence free
Fig. 5
Fig. 5
Validation of results using in-vitro gene expression data from resistant cell lines and proteomics analysis. a Normalised enrichment scores of differently upregulated genes (a total of 249) between long-term treated dormant and resistant tumours calculated using single sample gene set enrichment analysis (ssGSEA) in aromatase inhibitor-resistant cells. Scores were significantly higher (**p < 0.01, ***p < 0.001) in two aromatase inhibitor-resistant cell lines, MCF7:2A and MCF7:5C, which were clonally derived from MCF7 breast cancer cells following long-term oestrogen deprivation (LTED) compared with control/sensitive MCF7 cells (n = 4). Anastrozole-resistant (Ana_R) and exemestane-resistant (Exe_R) MCF7aro cells had significantly higher scores compared with control (n = 3). b Dynamic changes in enrichment scores of LTED MCF7 cells in three different datasets. c Scores in tamoxifen-resistant (Tam_R) and fulvestrant-resistant (Fulv_R) and drug-sensitive (control) MCF7 cells (n = 4, n = 10). d Volcano plot showing differentially expressed proteins between long-term treated dormant and resistant tumours (p < 0.05). Some overlapping features between transcriptomics and proteomics analysis and the most upregulated and downregulated proteins are highlighted in red and blue, respectively. FC fold-change, sc subclone
Fig. 6
Fig. 6
Immunohistochemical evaluation of methylation markers. a 5-methylcytosine (5-mC) and b 5-hydroxymethylcytosine (5-hmC) levels were determined in FFPE sections from letrozole-treated samples. Representative images in dormant and resistant tumours are shown. Boxplots show distributions of semi-quantitative intensity scores of 5-mC (*p < 0.05, ***p < 0.001; n = 5–12) and 5-hmC (***p < 0.001; n = 5–13) levels in dormant and resistant tumours. Early-on (early, 13–120 days) and long-term (long, > 120 days) neoadjuvant aromatase inhibitor therapy with letrozole

References

    1. EBCTCG Aromatase inhibitors versus tamoxifen in early breast cancer: patient-level meta-analysis of the randomised trials. Lancet. 2015;386(10001):1341–1352. - PubMed
    1. Demicheli R, Ardoino I, Boracchi P, Coradini D, Agresti R, Ferraris C, et al. Recurrence and mortality according to estrogen receptor status for breast cancer patients undergoing conservative surgery. Ipsilateral breast tumour recurrence dynamics provides clues for tumour biology within the residual breast. BMC Cancer. 2010;10:656. - PMC - PubMed
    1. Pan HC, Gray R, Braybrooke J, Davies C, Taylor C, McGale P, et al. 20-Year risks of breast-cancer recurrence after stopping endocrine therapy at 5 years. N Engl J Med. 2017;377(19):1836–1846. - PMC - PubMed
    1. Weigelt B, Glas AM, Wessels LF, Witteveen AT, Peterse JL, van't Veer LJ. Gene expression profiles of primary breast tumors maintained in distant metastases. Proc Natl Acad Sci U S A. 2003;100(26):15901–15905. - PMC - PubMed
    1. Tang MH, Dahlgren M, Brueffer C, Tjitrowirjo T, Winter C, Chen Y, et al. Remarkable similarities of chromosomal rearrangements between primary human breast cancers and matched distant metastases as revealed by whole-genome sequencing. Oncotarget. 2015;6(35):37169–37184. - PMC - PubMed

Publication types

MeSH terms