. 2019 Jan 8;16(1):1.
doi: 10.1186/s12987-018-0121-6.

Disruption of the hippocampal and hypothalamic blood-brain barrier in a diet-induced obese model of type II diabetes: prevention and treatment by the mitochondrial carbonic anhydrase inhibitor, topiramate

Affiliations

Disruption of the hippocampal and hypothalamic blood-brain barrier in a diet-induced obese model of type II diabetes: prevention and treatment by the mitochondrial carbonic anhydrase inhibitor, topiramate

Therese S Salameh et al. Fluids Barriers CNS. .

Abstract

Background: Type II diabetes is a vascular risk factor for cognitive impairment and increased risk of dementia. Disruption of the blood-retinal barrier (BRB) and blood-brain barrier (BBB) are hallmarks of subsequent retinal edema and central nervous system dysfunction. However, the mechanisms by which diet or metabolic syndrome induces dysfunction are not understood. A proposed mechanism is an increase in reactive oxygen species (ROS) and oxidative stress. Inhibition of mitochondrial carbonic anhydrase (mCA) decreases ROS and oxidative stress. In this study, topiramate, a mCA inhibitor, was examined for its ability to protect the BRB and BBB in diet-induced obese type II diabetic mice.

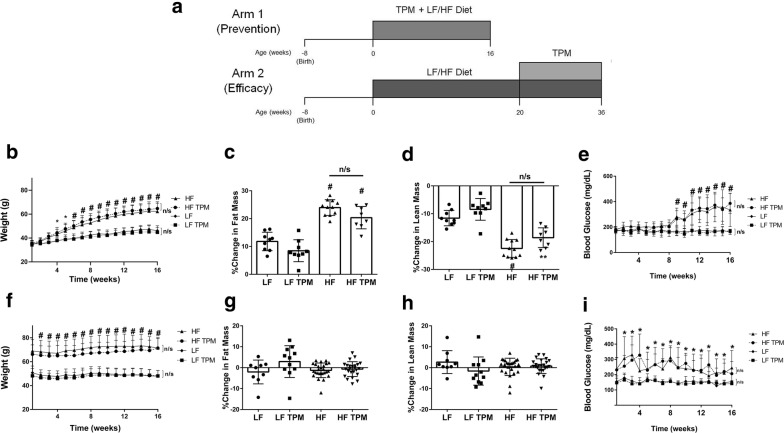
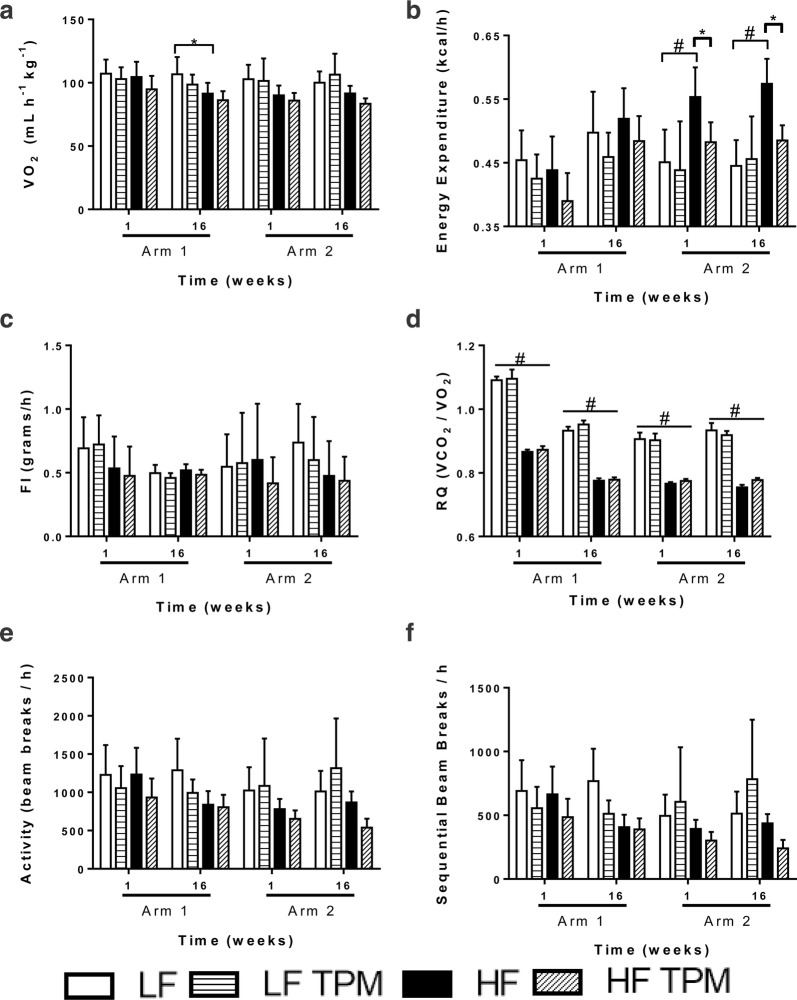
Methods: BBB and BRB permeability were assessed using 14C-sucrose and 99mTc-albumin in CD-1 mice fed a low-fat (control) or a high-fat diet. Topiramate administration was compared to saline controls in both preventative and efficacy arms examining BRB and BBB disruption. Body weight and blood glucose were measured weekly and body composition was assessed using EchoMRI. Metabolic activity was measured using a comprehensive laboratory animal monitoring system. Brain tissues collected from the mice were assessed for changes in oxidative stress and tight junction proteins.

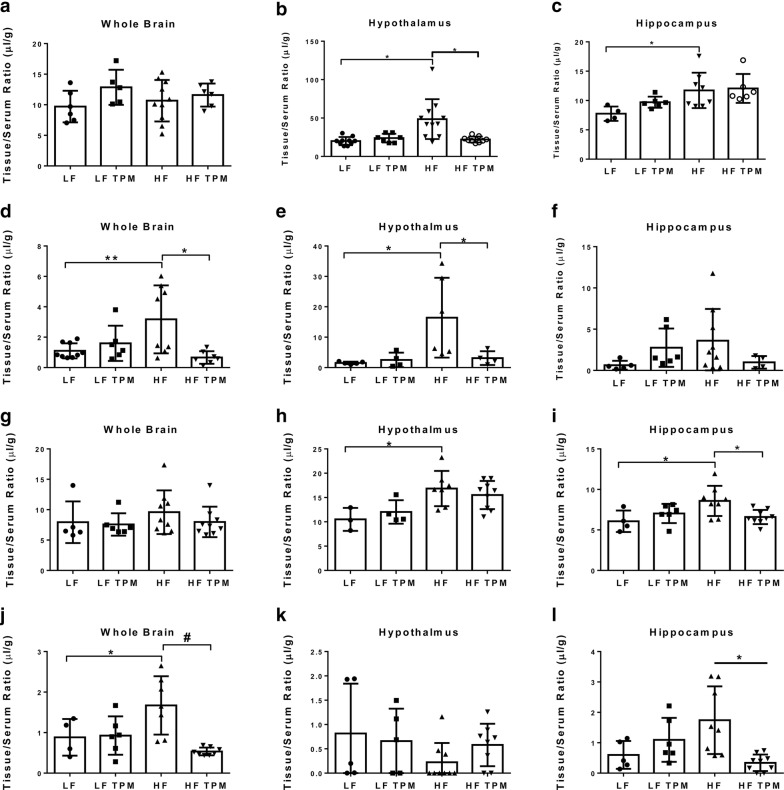
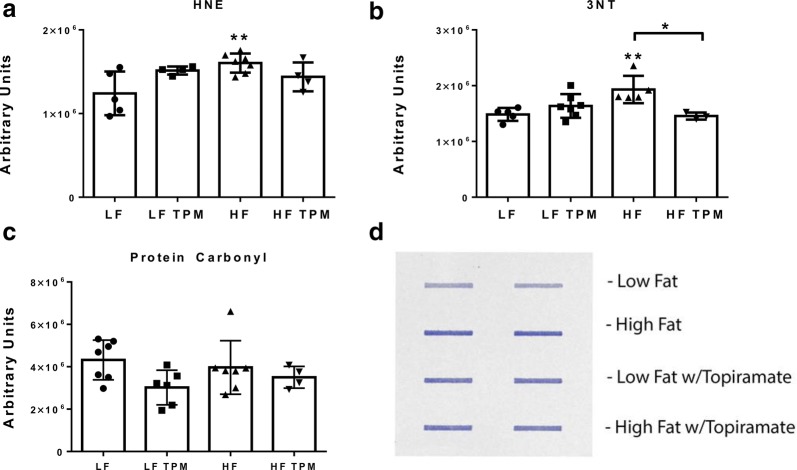
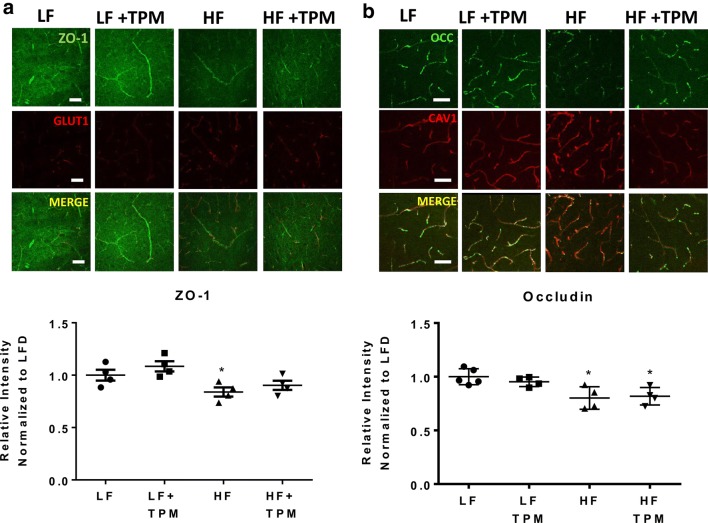
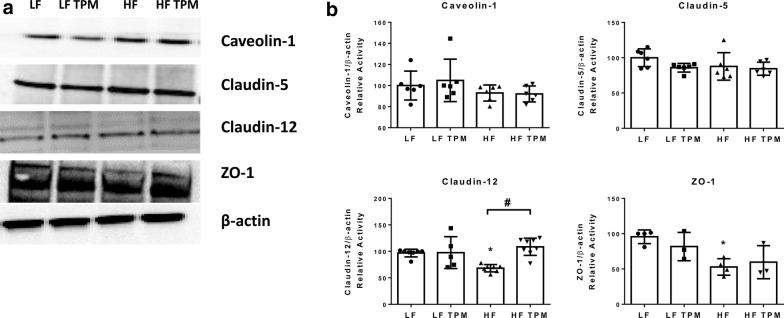
Results: High-fat feeding caused increased entry of 14C-sucrose and 99mTc-albumin into the brains of diet-induced obese type II diabetic mice. Increased permeability to 14C-sucrose was observed in the hypothalamus and hippocampus, and attenuated by topiramate treatment, while increased permeability to 99mTc-albumin occurred in the whole brain and was also attenuated by topiramate. Treatment with topiramate decreased measures of oxidative stress and increased expression of the tight junction proteins ZO-1 and claudin-12. In the retina, we observed increased entry of 99mTc-albumin simultaneously with increased entry into the whole brain during the preventative arm. This occurred prior to increased entry to the retina for 14C-sucrose which occurred during the efficacy arm. Treatment with topiramate had no effect on the retina.

Conclusions: Blood-brain barrier and blood-retinal barrier dysfunction were examined in a mouse model of diet-induced obese type II diabetes. These studies demonstrate that there are spatial and temporal differences in 14C-sucrose and 99mTc-albumin permeability in the brain and retina of diet-induced obese type II diabetic mice. Topiramate, a mitochondrial carbonic anhydrase inhibitor, is efficacious at both preventing and treating BBB disruption in this diet-induced obese type II diabetic mouse model.

Keywords: Blood–brain barrier; Blood–retinal barrier; Hippocampus; Hypothalamus; Topiramate; Type II diabetes.


Figures

Fig. 1
Fig. 1
Effects of diet and topiramate treatment on body composition and blood glucose in CD-1 mice. A schematic diagram illustrating the difference in design between arm 1 and 2 of the study (a). Total body weight over the 16 weeks of TPM treatment for arm 1 (b; started with HF diet and thus prior to obesity) and arm 2 (f; started after establishment of obesity). HF consumption led to significant increases in body weight compared to LF diet in both arms. Topiramate treatment had no effect on weight gain. Change in fat mass as a percentage calculated using fat mass measured at the beginning and end of the treatment cycle for arm 1 (c) and arm 2 (g) of the study. Change in lean mass presented as a percentage change from the beginning of the treatment cycle for arm 1 (d) and arm 2 (h) of the study. Topiramate had no effect on lean and fat mass. Nonfasted measurements of blood glucose over the 16 week treatment period for arm 1 (e) and arm 2 (i). In both arms, HF feeding led to a significant increase in nonfasted blood glucose, which was not effected by TPM treatment. Values are expressed as mean ± SD. Significance was determined by a one-way analysis of variance followed by Newman–Keuls post-test for HF vs. LF, LF vs. LF TPM, and HF vs. HF TPM. *p < 0.05; **p < 0.01; #p < 0.001
Fig. 2
Fig. 2
Metabolic activity of topiramate-treated CD-1 mice. Metabolic data collected from the laboratory animal monitoring system (CLAMS) after 1 week and 16 weeks of TPM administration as a preventative (arm 1) or efficacy (arm 2) agent from LF diet + saline (n = 8), LF diet + TPM (n = 8), HF diet + saline (n = 8), and HF diet + TPM (n = 8) in each arm. Mice were administered treatments once daily and measured for 72 h. Data collected includes a oxygen consumption (VO2; mL/h/kg), b energy expenditure (kcal/h), c food intake (FI; grams/h), d respiratory quotient (RQ: VCO2/VO2), e total activity (beam breaks/h), and f ambulatory activity (sequential beam breaks/h). Values are expressed as mean ± SD. Significance was determined by a one-way analysis of variance followed by Newman–Keuls post-test between HF vs. LF, LF vs. LF TPM, and HF vs. HF TPM. *p < 0.05; #p < 0.001
Fig. 3
Fig. 3
Effect of diet and topiramate on metabolism-related hormones. Serum samples collected from LF diet + saline (n = 10), LF diet + TPM (n = 11), HF diet + saline (n = 8), and HF diet + TPM (n = 8). Serum was measured for a ghrelin, b glucose-dependent insulinotropic peptide, GIP, c glucagon-like peptide-1, GLP-1, d glucagon, e insulin, f leptin, g plasminogen activator inhibitor-1, PAI-1, and h resistin. Ghrelin showed a significant decrease after HF-feeding, while GIP, insulin, and leptin showed a significant increase. Topiramate treatment had no significant effect at either low- or high-fat feeding. Values are expressed as mean ± SD. Significance was determined by a one-way analysis of variance followed by Newman–Keuls post-test between HF vs. LF, LF vs. LF TPM, and HF vs. HF TPM. *p < 0.05; **p < 0.01; #p < 0.001
Fig. 4
Fig. 4
Measurement of blood–brain barrier permeability changes in diet-induced obesity. These histograms are representative of data highlighted in Tables 1 and 2. 14C-labeled sucrose (342 Da; Table 2) was used to measure BBB permeability changes in the whole brain (a prevention; g efficacy), hypothalamus (b prevention; h efficacy), and hippocampus (c prevention; i efficacy). 99mTc-labeled albumin (65 kDa; Table 1) was used to measure BBB permeability changes in the whole brain (d prevention; j efficacy), hypothalamus (e prevention; k efficacy), and hippocampus (f prevention; l efficacy). Values are expressed as mean ± SD. Significance was determined by a one-way analysis of variance followed by Newman–Keuls post-test for HF vs. LF, LF vs. LF TPM, and HF vs. HF TPM. *p < 0.05; **p < 0.01; #p < 0.001
Fig. 5
Fig. 5
Effect of diet and topiramate on oxidative stress. Changes in 4- hydroxynonenal (HNE, a), 3-nitrotyrosine (3-NT, b), and protein carbonyls (c) levels in mouse brain homogenates from LF- and HF-fed CD-1 mice treated with or without TPM. HF diet led to a significant increase in HNE and 3-NT compared to LF controls. These increases were attenuated with TPM treatment. HF diet had no effect on protein carbonyls. The image in d is representative of the slot blot data used to collect these values. Values are expressed as arbitrary units, mean ± SD. Significance was determined by a one-way analysis of variance followed by Newman–Keuls post-test for HF vs. LF, LF vs. LF TPM, and HF vs. HF TPM. *p < 0.05; **p < 0.01
Fig. 6
Fig. 6
Effect of diet and topiramate on tight junction protein expression using immunofluorescence. Immunohistochemical techniques were used on tissue from the hypothalamus to examine ZO-1 (a) and occludin (b) expression in LF- and HF-fed CD-1 mice treated with or without TPM (a). ZO-1 and occludin expression were significantly decreased with HF-diet feeding compared to LF-fed controls. TPM treatment attenuated ZO-1 expression. GLUT1 was used as a vessel marker for ZO-1 and CAV1 as a vessel marker for occludin. The merged image localizes the tight junction staining to the vessels. Scale bar is 50 microns. Values are expressed as mean ± SD. Significance was determined by a one-way analysis of variance followed by Newman–Keuls post-test between HF vs. LF, LF vs. LF TPM, and HF vs. HF TPM. *p < 0.05
Fig. 7
Fig. 7
Effect of diet and topiramate on tight junction protein expression using immunoblot. Whole brain lysate was used to examine expression of the tight junction proteins, claudin-5, claudin-12, and ZO-1, and caveolin-1, the major structural protein of caveolae (a). HF-diet consumption led to a significant decrease in claudin-12 and ZO-1 expression which was attenuated with TPM treatment for claudin-12 (b). There were no significant changes in calveolin-1 or claudin-5. Values are expressed as mean ± SD and relative to the β-actin loading control. Significance was determined by a one-way analysis of variance followed by Newman–Keuls post-test between HF vs. LF, LF vs. LF TPM, and HF vs. HF TPM. *p < 0.05; #p < 0.001

Similar articles

Cited by

References

    1. Kanoski SE, Davidson TL. Western diet consumption and cognitive impairment: links to hippocampal dysfunction and obesity. Physiol Behav. 2011;103(1):59–68. - PMC - PubMed
    1. Hu N, Yu J-T, Tan L, Wang Y-L, Sun L, Tan L. Nutrition and the risk of Alzheimer’s disease. Biomed Res Int. 2013;2013:524820. - PMC - PubMed
    1. Davidson TL, Monnot A, Neal AU, Martin AA, Horton JJ, Zheng W. The effects of a high-energy diet on hippocampal-dependent discrimination performance and blood–brain barrier integrity differ for diet-induced obese and diet-resistant rats. Physiol Behav. 2012;107(1):26–33. - PMC - PubMed
    1. Ozkan E, Gocmen R, Topcuoglu MA, Arsava EM. Blood–retina-barrier disruption accompanying blood–brain-barrier dysfunction in posterior reversible encephalopathy syndrome. J Neurol Sci. 2014;346(1):315–317. - PubMed
    1. Greiner J, Dorovini-Zis K, Taylor TE, Molyneux ME, Beare NAV, Kamiza S, White VA. Correlation of hemorrhage, axonal damage, and blood–tissue barrier disruption in brain and retina of Malawian children with fatal cerebral malaria. Front Cell Infect Microbiol. 2015;5:18. - PMC - PubMed

MeSH terms