. 2019 Jan 22;116(2):215-226.
doi: 10.1016/j.bpj.2018.12.007. Epub 2018 Dec 14.

Molecular Mechanisms of Macular Degeneration Associated with the Complement Factor H Y402H Mutation

Affiliations

Molecular Mechanisms of Macular Degeneration Associated with the Complement Factor H Y402H Mutation

Reed E S Harrison et al. Biophys J. .

Abstract

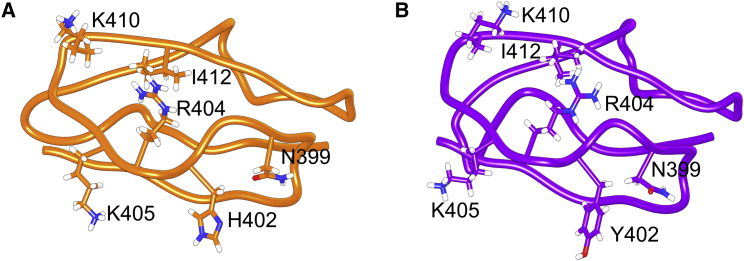
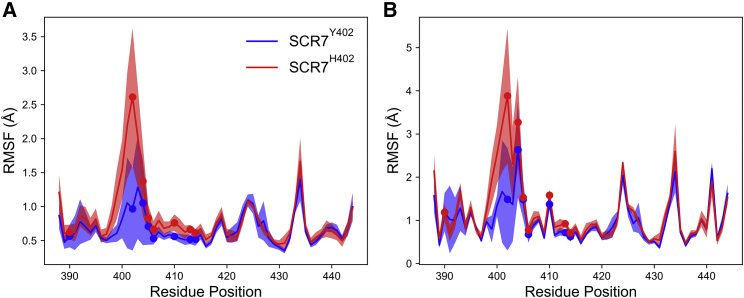
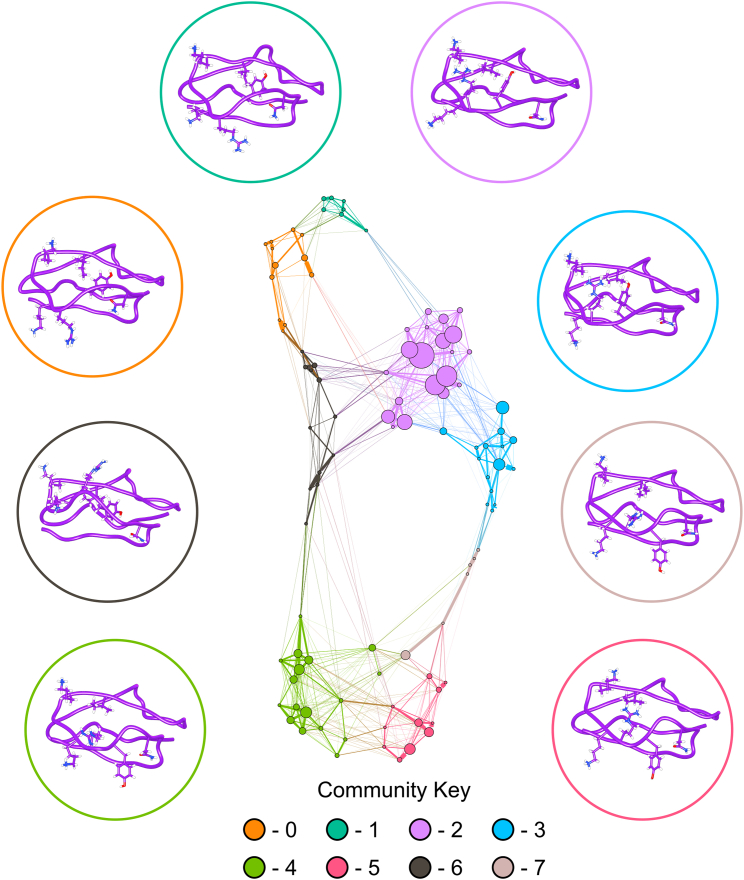
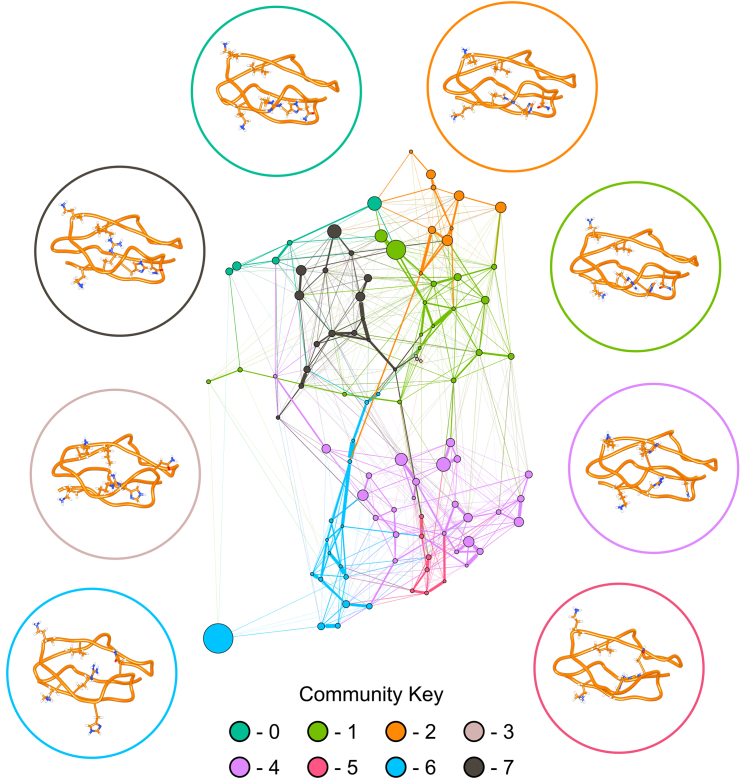
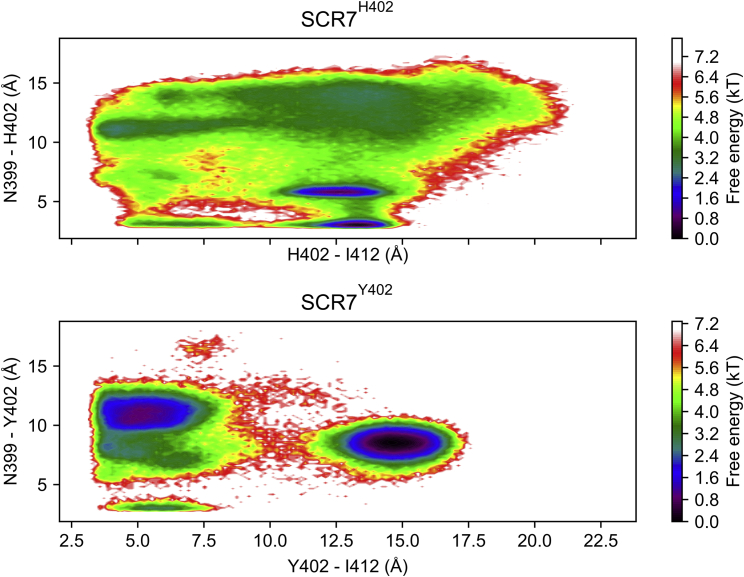
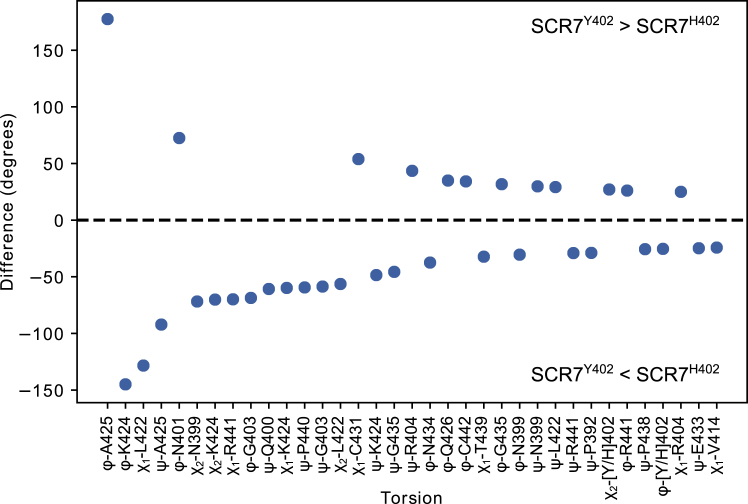
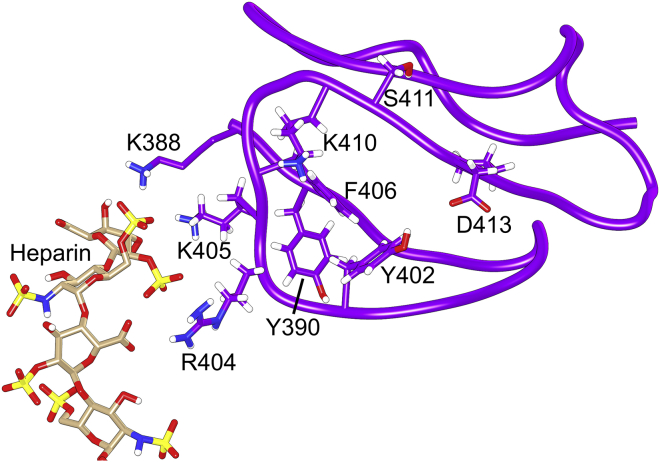
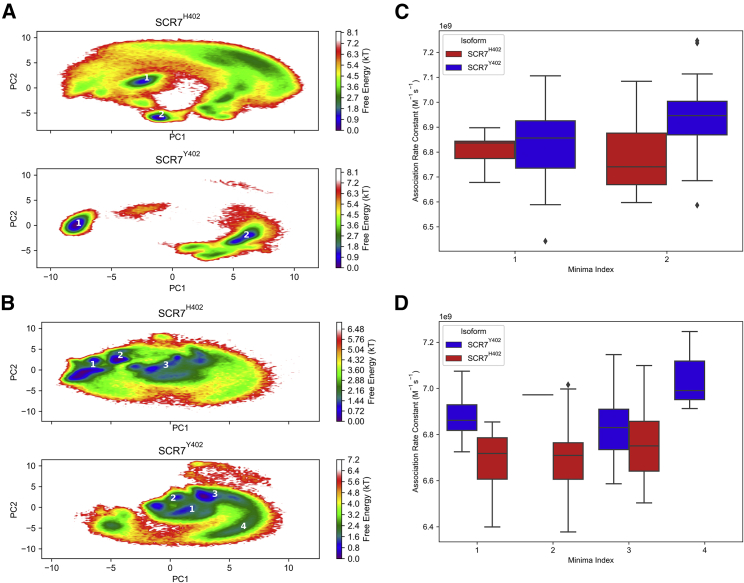
A single nucleotide polymorphism, tyrosine at position 402 to histidine (Y402H), within the gene encoding complement factor H (FH) predisposes individuals to acquiring age-related macular degeneration (AMD) after aging. This polymorphism occurs in short consensus repeat (SCR) 7 of FH and results in decreased binding affinity of SCR6-8 for heparin. As FH is responsible for regulating the complement system, decreased affinity for heparin results in decreased regulation on surfaces of self. To understand the involvement of the Y402H polymorphism in AMD, we leverage methods from bioinformatics and computational biophysics to quantify structural and dynamical differences between SCR7 isoforms that contribute to decreased pattern recognition in SCR7H402. Our data from molecular and Brownian dynamics simulations suggest a revised mechanism for decreased heparin binding. In this model, transient contacts not observed in structures for SCR7 are predicted to occur in molecular dynamics simulations between coevolved residues Y402 and I412, stabilizing SCR7Y402 in a conformation that promotes association with heparin. H402 in the risk isoform is less likely to form a contact with I412 and samples a larger conformational space than Y402. We observe energy minima for sidechains of Y402 and R404 from SCR7Y402 that are predicted to associate with heparin at a rate constant faster than energy minima for sidechains of H402 and R404 from SCR7H402. As both carbohydrate density and degree of sulfation decrease with age in Bruch's membrane of the macula, the decreased heparin recognition of SCR7H402 may contribute to the pathogenesis of AMD.


Figures

Figure 1
Figure 1
Structural representations of SCR7 are shown with key residues labeled. HSQC experiments suggest chemical shift perturbations at labeled residues due to heparin binding. Aside from the Y402H polymorphism, structure is largely conserved between (A) SCR7H402 from x-ray crystallography and (B) SCR7Y402 from NMR. For all subsequent molecular graphics, we will display the same amino acid side chains and maintain a color scheme where SCR7H402 is orange and SCR7Y402 is purple. To see this figure in color, go online.
Figure 2
Figure 2
Mean RMSF in (A) Cα positions and (B) side-chain centroids for SCR7Y402 (blue) and SCR7H402 (red) are shown for each residue position in SCR7. Shaded regions correspond to one standard deviation above and below the mean RMSF values. Circles are placed in RMSF plots to denote the location of residues Y390, [Y/H]402, R404, K405, F406, K410, D413, V414. Greater differences in RMSF between SCR7 isoforms are observed in Cα positions than in side-chain centroids. Additionally, the Y402H polymorphism is associated with increased RMSF for residues proximal to position 402. To see this figure in color, go online.
Figure 3
Figure 3
Graphical representation of conformational sampling of SCR7Y402 is shown with representative structures for each community within the network. Nodes are conformational states from the discretized trajectories that are scaled in size according to the associated probability from the stationary distribution of the Markov chain. Edges represent transitions between conformational states and are scaled according to the associated probability from the Markov chain. Nodes are colored according to community membership, and a representative structure of SCR7Y402 is shown for each community. Circles surrounding conformational states denote community membership of each structure, and amino acid side chains for residues N399, Y402, R404, K405, K410, and I412 are displayed. Interestingly, nodes within communities are more connected with other nodes in the same community than with nodes of other communities. This observation suggests a high degree of modularity within the network. To see this figure in color, go online.
Figure 4
Figure 4
Graphical representation of conformational sampling of SCR7H402 is shown with representative structures for each community within the network. Nodes are conformational states from the discretized trajectories that are scaled in size according to the associated probability from the stationary distribution of the Markov chain. Edges represent transitions between conformational states and are scaled according to the associated probability from the Markov chain. Nodes are colored according to community membership, and a representative structure of SCR7Y402 is shown for each community. Circles surrounding conformational states denote community membership of each structure, and amino acid side chains for residues N399, H402, R404, K405, K410, and I412 are displayed. Compared to the network for SCR7Y402 (Fig. 3), the network for SCR7H402 appears far less modular because there are more edges between nodes of different communities. To see this figure in color, go online.
Figure 5
Figure 5
Free energy landscapes for distances between residue pairs [Y/H]402 – I412 and N399 – [Y/H]402 are displayed for each SCR7 isoform. The distance between [Y/H]402 and I412 is calculated from the positions of atom CE1 in Y402 or H402 and atom CD1 in I412, whereas the distance between N399 and [Y/H]402 is calculated from atom ND2 in N399 and atom ND1 or OH in H402 or Y402, respectively. Free energies are indicated by inset color bar. States with lower free energy are expected to be observed with higher frequency. Note how the free energy landscape for SCR7Y402 is more constrained to two minima than SCR7H402 that samples a larger area of the landscape. Also note how SCR7Y402 is more likely to form a contact between Y402 and I412 with a cutoff distance of 4 Å than SCR7H402, while SCR7H402 is more likely to form a contact between N399 and H402 with a cutoff distance of 4 Å than SCR7Y402. To see this figure in color, go online.
Figure 6
Figure 6
Expected differences of torsion angles between Markov chains for SCR7 isoforms are displayed. Torsions larger in SCR7Y402 are located above the dashed line, whereas torsions larger in SCR7H402 are located below the dashed line. Torsion types and residue membership are labeled along the x axis in order of decreasing magnitude difference between isoforms. Expected torsions appear to be different between SCR7 isoforms at residues L422 and A425, though these differences result in small side-chain rearrangements. Expected torsions also differ at residues N399–R404, resulting in more appreciable differences in sidechain arrangements. To see this figure in color, go online.
Figure 7
Figure 7
Example encounter complex between SCR7Y402 and heparin (dp12) from a BD trajectory where binding occurs. All annotated residues on SCR7 except K388 have been implicated in binding heparin by HSQC NMR and mutagenesis experiments. To see this figure in color, go online.
Figure 8
Figure 8
Free energy landscapes for a two-dimensional representation of side-chain orientations for residues (A) [Y/H]402 and (B) R404 are shown for SCR7 isoforms. To describe the orientation of side chains, position vectors are found from coordinates of heavy atoms NE2 in H402, OH in Y402, and CZ in R404 and decomposed into two dimensions with principal component analysis. Regions of the landscape are annotated with numbers that correspond to energy minima, with free energy values of 2 kT or below. Free energies are indicated by the inset color bar. Box plots display predicted heparin association rate constants for each free energy minimum in SCR7 isoforms for (C) the side-chain orientation of [Y/H]402 and (D) the side-chain orientation of R404. Regions with high average association rate constants are more closely associated with energy minima of SCR7Y402. To see this figure in color, go online.

References

    1. de Juan D., Pazos F., Valencia A. Emerging methods in protein co-evolution. Nat. Rev. Genet. 2013;14:249–261. - PubMed
    1. Sutto L., Marsili S., Gervasio F.L. From residue coevolution to protein conformational ensembles and functional dynamics. Proc. Natl. Acad. Sci. USA. 2015;112:13567–13572. - PMC - PubMed
    1. Liszewski M.K., Atkinson J.P. Complement regulators in human disease: lessons from modern genetics. J. Intern. Med. 2015;277:294–305. - PubMed
    1. Herbert A.P., Deakin J.A., Barlow P.N. Structure shows that a glycosaminoglycan and protein recognition site in factor H is perturbed by age-related macular degeneration-linked single nucleotide polymorphism. J. Biol. Chem. 2007;282:18960–18968. - PubMed
    1. Clark S.J., Higman V.A., Day A.J. His-384 allotypic variant of factor H associated with age-related macular degeneration has different heparin binding properties from the non-disease-associated form. J. Biol. Chem. 2006;281:24713–24720. - PubMed

Publication types