Review
. 2019 Oct 1;9(10):a026898.
doi: 10.1101/cshperspect.a026898.

Single-Cell Applications of Next-Generation Sequencing

Affiliations
Review

Single-Cell Applications of Next-Generation Sequencing

Naishitha Anaparthy et al. Cold Spring Harb Perspect Med. .

Abstract

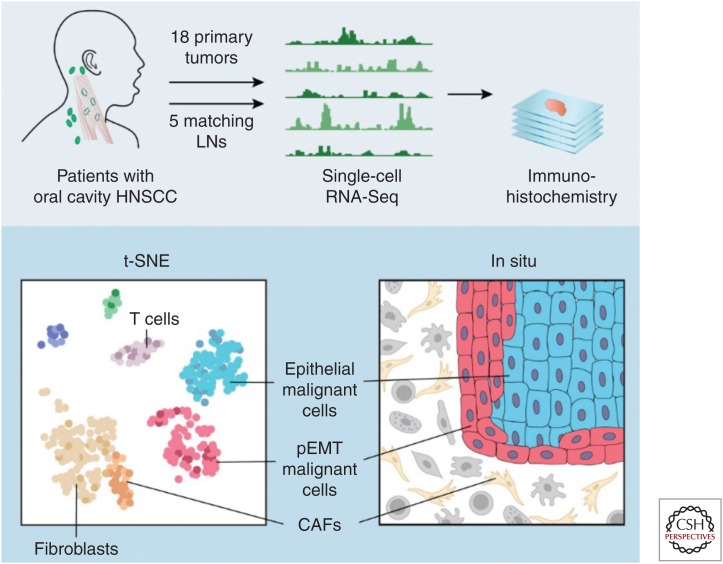
The single cell is considered the basic unit of biology, and the pursuit of understanding how heterogeneous populations of cells can functionally coexist in tissues, organisms, microbial ecosystems, and even cancer, makes them the subject of intense study. Next-generation sequencing (NGS) of RNA and DNA has opened a new frontier of (single)-cell biology. Hundreds to millions of cells now can be assayed in parallel, providing the molecular profile of each cell in its milieu inexpensively and in a manner that can be analyzed mathematically. The goal of this article is to provide a high-level overview of single-cell sequencing for the nonexpert and show how its applications are influencing both basic and applied clinical studies in embryology, developmental genetics, and cancer.


Figures

Figure 1.
Figure 1.
Schematic diagrams of single-cell RNA amplification using the strand-switching methodology, showing the molecular steps in generating double-stranded cDNA with sample barcodes and unique molecular identifiers (UMIs) (top); and the application of the basic method in the 10X high-throughput droplet/bead capture microfluidic mode (bottom). (Figures courtesy of 10X Genomics.)
Figure 2.
Figure 2.
Examples of a single-cell RNA (scRNA) sequence analysis to detect the molecular basis of drug resistance in melanoma. (A) Scheme for generating drug resistant derivatives. (B) Testing resistant cells. (C) Using signature melanoma signature genes to cluster bulk RNA-Seq data from cell lines. (D) t-SNE map was used to display the expression profiles of 400 single cells isolated using the Fluidigm C-1 instrument. (E) Heat map showing expression of highly expressed and highly variable genes. (F) t-SNE plot of scRNA-Seq of 6545 cells performed on a 10X Chromium instrument. (G) Direct comparison of Fluidigm cells and Chromium cells showing similar differences between resistant and parental but distinct patterns for the two methods. (H) Differential expression analysis identifies genes significantly altered in the resistant cell line derivative (for details, see Ho et al. 2018).
Figure 3.
Figure 3.
The core components to the flow of sample and data processing by SNS. (A) Single-nucleus sequencing (top panel), through sequence read mapping and derivation of single-cell copy number profiles (middle panel), to clonal structure analysis and visualization (bottom panel). (B) Magnified view of clonal structure of a primary prostate cancer case contrasting the degree of genomic complexity between the two clones. There are two color tracks below dendrogram for clones and subclones and they are designated as follows: NYU007.GS7.2.1 (red) with its two subclones, NYU007.GS7.2.1.1 (green) and NYU007.GS7.2.1.2 (orange) and NYU007.GS7.2.2 (yellow) with its single subclone, NYU007.GS7.2.2.1 (pink). B shows inferred clonal progression for the clones using the same color scheme for clones and subclones as described in A. (From Alexander et al. 2018; reprinted courtesy of the American Association for Cancer Research.) (Note the ancestral mutant cell is designated by a blue circle.)
Figure 3.
Figure 3.
The core components to the flow of sample and data processing by SNS. (A) Single-nucleus sequencing (top panel), through sequence read mapping and derivation of single-cell copy number profiles (middle panel), to clonal structure analysis and visualization (bottom panel). (B) Magnified view of clonal structure of a primary prostate cancer case contrasting the degree of genomic complexity between the two clones. There are two color tracks below dendrogram for clones and subclones and they are designated as follows: NYU007.GS7.2.1 (red) with its two subclones, NYU007.GS7.2.1.1 (green) and NYU007.GS7.2.1.2 (orange) and NYU007.GS7.2.2 (yellow) with its single subclone, NYU007.GS7.2.2.1 (pink). B shows inferred clonal progression for the clones using the same color scheme for clones and subclones as described in A. (From Alexander et al. 2018; reprinted courtesy of the American Association for Cancer Research.) (Note the ancestral mutant cell is designated by a blue circle.)
Figure 4
Figure 4
. Schematic of multiplex analysis of head and neck tumors. HNSCC, head and neck squamous cell cancer; LNs, lymph nodes; pEMT, partial epithelial mesenchymal transition; CAFs, cancer-associated fibroblasts. (From Puram et al. 2017; reprinted, with permission, from Elsevier © 2017.)
Figure 5.
Figure 5.
Tumor cell identification and clonal lineage by single-cell copy number variants (CNVs) profiling. Heat map and phylogenic tree of CNVs across the entire population of cells from metastatic circulation (MTC), bone marrow biopsy (BMTP), and primary resection (PTP). Sample type and clones are identified using color key. Three clones were identified: clone 1 consisting of prostate cells with hallmark alterations, clone 2 with few copy number alterations (CNAs), and clone 3 showing lineage relationship of bone marrow, primary, and circulation. Key genes such as MYC, NCOA2, PTEN, and TP53 have been highlighted by chromosome location across clone and sample type. (From Malihi et al. 2018; reprinted courtesy of the American Association for Cancer Research.)

References

    1. Adamson B, Norman TM, Jost M, Cho MY, Nuñez JK, Chen Y, Villalta JE, Gilbert LA, Horlbeck MA, Hein MY, et al. 2016. A multiplexed single-cell CRISPR screening platform enables systematic dissection of the unfolded protein response. Cell 167: 1867–1882.e21. 10.1016/j.cell.2016.11.048 - DOI - PMC - PubMed
    1. Alexander J, Kendall J, McIndoo J, Rodgers L, Aboukhalil R, Levy D, Stepansky A, Sun G, Chobardjiev L, Riggs M, et al. 2018. Utility of single-cell genomics in diagnostic evaluation of prostate cancer. Cancer Res 78: 348–358. 10.1158/0008-5472.CAN-17-1138 - DOI - PMC - PubMed
    1. Angermueller C, Clark SJ, Lee HJ, Macaulay IC, Teng MJ, Hu TX, Krueger F, Smallwood S, Ponting CP, Voet T, et al. 2016. Parallel single-cell sequencing links transcriptional and epigenetic heterogeneity. Nat Methods 13: 229–232. 10.1038/nmeth.3728 - DOI - PMC - PubMed
    1. Azizi E, Carr AJ, Plitas G, Cornish AE, Konopacki C, Prabhakaran S, Nainys J, Wu K, Kiseliovas V, Setty M, et al. 2018. Single-cell map of diverse immune phenotypes in the breast tumor microenvironment. Cell 174: 1293–1308.e36. 10.1016/j.cell.2018.05.060 - DOI - PMC - PubMed
    1. Baslan T, Hicks J. 2017. Unravelling biology and shifting paradigms in cancer with single-cell sequencing. Nat Rev Cancer 17: 557–569. - PubMed

Publication types

LinkOut - more resources