

Socioecologically informed use of remote sensing data to predict rural household poverty
- PMID: 30617073
- PMCID: PMC6347693
- DOI: 10.1073/pnas.1812969116
Socioecologically informed use of remote sensing data to predict rural household poverty
Abstract
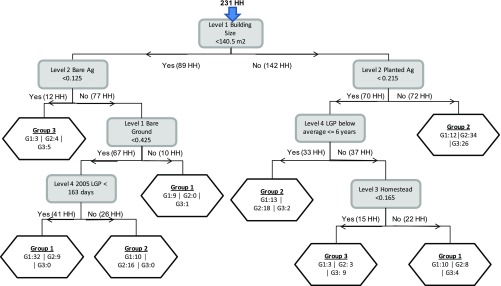
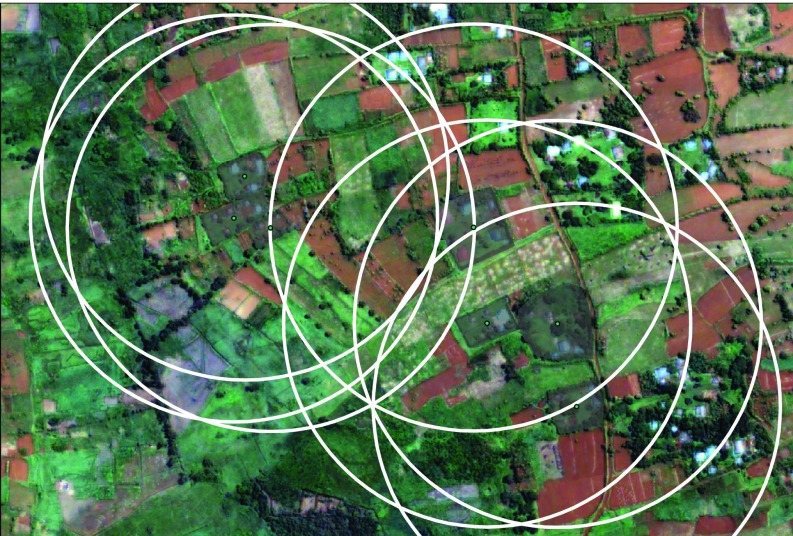
Tracking the progress of the Sustainable Development Goals (SDGs) and targeting interventions requires frequent, up-to-date data on social, economic, and ecosystem conditions. Monitoring socioeconomic targets using household survey data would require census enumeration combined with annual sample surveys on consumption and socioeconomic trends. Such surveys could cost up to $253 billion globally during the lifetime of the SDGs, almost double the global development assistance budget for 2013. We examine the role that satellite data could have in monitoring progress toward reducing poverty in rural areas by asking two questions: (i) Can household wealth be predicted from satellite data? (ii) Can a socioecologically informed multilevel treatment of the satellite data increase the ability to explain variance in household wealth? We found that satellite data explained up to 62% of the variation in household level wealth in a rural area of western Kenya when using a multilevel approach. This was a 10% increase compared with previously used single-level methods, which do not consider details of spatial landscape use. The size of buildings within a family compound (homestead), amount of bare agricultural land surrounding a homestead, amount of bare ground inside the homestead, and the length of growing season were important predictor variables. Our results show that a multilevel approach linking satellite and household data allows improved mapping of homestead characteristics, local land uses, and agricultural productivity, illustrating that satellite data can support the data revolution required for monitoring SDGs, especially those related to poverty and leaving no one behind.
Keywords: SDGs; population environment; poverty; remote sensing; socioecological systems.
Copyright © 2019 the Author(s). Published by PNAS.
Conflict of interest statement
The authors declare no conflict of interest.
Figures
References
-
- Griggs D, et al. Policy: Sustainable development goals for people and planet. Nature. 2013;495:305–307. - PubMed
-
- Jacob A. Mind the gap: Analyzing the impact of data gap in Millennium Development Goals’ (MDGs) indicators on the progress toward MDGs. World Dev. 2017;93:260–278.
-
- Jerven M. 2014a. Benefits and costs of the data for development targets for the Post-2015 Development Agenda, Data for Development Assessment Working Paper, September 16, 2014.
-
- IEAG . Independent Expert Advisory Group on a Data Revolution for Sustainable Development. United Nations; New York: 2014. A world that counts: Mobilising the data revolution for sustainable development.
-
- Devarajan S. Africa’s statistical tragedy. Rev Income Wealth. 2013;59:9–15.
Publication types
MeSH terms
LinkOut - more resources
Full Text Sources
Medical
