A dual role for cell plate-associated PI4Kβ in endocytosis and phragmoplast dynamics during plant somatic cytokinesis
- PMID: 30617084
- PMCID: PMC6376452
- DOI: 10.15252/embj.2018100303
A dual role for cell plate-associated PI4Kβ in endocytosis and phragmoplast dynamics during plant somatic cytokinesis
Abstract
Plant cytokinesis involves membrane trafficking and cytoskeletal rearrangements. Here, we report that the phosphoinositide kinases PI4Kβ1 and PI4Kβ2 integrate these processes in Arabidopsis thaliana (Arabidopsis) roots. Cytokinetic defects of an Arabidopsis pi4kβ1 pi4kβ2 double mutant are accompanied by defects in membrane trafficking. Specifically, we show that trafficking of the proteins KNOLLE and PIN2 at the cell plate, clathrin recruitment, and endocytosis is impaired in pi4kβ1 pi4kβ2 double mutants, accompanied by unfused vesicles at the nascent cell plate and around cell wall stubs. Interestingly, pi4kβ1 pi4kβ2 plants also display ectopic overstabilization of phragmoplast microtubules, which guide membrane trafficking at the cell plate. The overstabilization of phragmoplasts in the double mutant coincides with mislocalization of the microtubule-associated protein 65-3 (MAP65-3), which cross-links microtubules and is a downstream target for inhibition by the MAP kinase MPK4. Based on similar cytokinetic defects of the pi4kβ1 pi4kβ2 and mpk4-2 mutants and genetic and physical interaction of PI4Kβ1 and MPK4, we propose that PI4Kβ and MPK4 influence localization and activity of MAP65-3, respectively, acting synergistically to control phragmoplast dynamics.
Keywords: Cell division; cell plate; clathrin‐mediated endocytosis, phosphoinositides; mitogen‐activated protein kinase 4.
© 2019 The Authors.
Figures
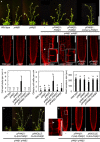
The growth phenotype of the Arabidopsis pi4kβ1 pi4kβ2 double mutant can be complemented by ectopic expression of PI4Kβ1 or PI4Kβ2 or by mCherry‐tagged PI4Kβ1 expressed from a genomic fragment. Plants shown are 1 month old. Scale bar, 10 cm.
The irregularities in the pattern of root epidermal cell division orientation of the pi4kβ1 pi4kβ2 double mutant are also complemented by ectopic expression of PI4Kβ variants, as shown by propidium iodide (PI) staining of 5‐day‐old roots. Arrowhead, oblique cell wall. Insets, magnifications of areas showing cell wall stubs. Scale bars, 50 μm.
Quantifications of cell wall stubs, oblique cell walls and root meristem size (wild type, n = 15 roots; pi4kβ1, n = 15 roots; pi4kβ2, n = 14 roots; pi4kβ1 pi4kβ2, n = 18 roots; pPI4Kβ1:PI4Kβ1, n = 14 roots, pPI4Kβ2:PI4Kβ2, n = 15 roots). n.d., not detected. Data are mean ± SD. Lowercase letters indicate a significant increase of oblique cell walls (Welch ANOVA with Games‐Howell post hoc test; P < 0.0001) or a significant reduction of root meristem size in the pi4kβ1 pi4kβ2 double mutant (one‐way ANOVA with post hoc Tukey HSD; P < 0.001).
Complementation of the pi4kβ1 pi4kβ2 phenotype by functional FLAG‐PI4Kβ1 expressed from the intrinsic pPI4Kβ1 or the pKNOLLE promoters, as indicated, shown for 1‐month‐old plants. Scale bar, 10 cm. Complementation with the pKNOLLE‐driven construct indicates functionality of PI4Kβ1 during cell plate formation in G2/M phase.
PI staining of pKNOLLE:FLAG‐PI4Kβ1 expressed in the pi4kβ1 pi4kβ2 double mutant background indicates rescue of cytokinetic defects. Arrowhead, cell wall stub in the pi4kβ1 pi4kβ2 double mutant. Scale bars, 50 μm. Further phenotypic aspects of the pKNOLLE:FLAG‐PI4Kβ1‐complemented double mutants can be seen in Appendix Fig S1.
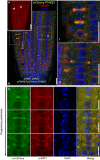
In vivo localization of mCherry‐PI4Kβ1 expressed from the pPI4Kβ1 promoter in root tips of 5‐day‐old complemented pi4kβ1 pi4kβ2 plants. The mCherry‐PI4Kβ1 distribution was imaged using a Zeiss LSM880 in Airyscan Virtual Pinhole (VP) mode with the pinhole set to 2. Arrowheads, nascent cell plates decorated by mCherry‐PI4Kβ1. Scale bar, 20 μm.
Whole‐mount immunostaining of 5‐day‐old seedlings expressing mCherry‐PI4kβ1 in the pi4kβ1 pi4kβ2 double mutant background using anti‐tubulin (red) and anti‐mCherry (green) antibodies, and DAPI (blue). (I), (II), magnifications of regions marked in b, representing early and late cytokinetic stages. Scale bars, 20 μm.
Relative localization of mCherry‐PI4Kβ1 and the TGN marker, ARF1, during cytokinesis. Four‐day‐old seedlings were immunostained with anti‐mCherry (green) and anti‐ARF1 (red) antibodies. Scale bars are 10 μm. Further controls for the use of the anti‐mCherry antibodies can be seen in Appendix Fig S3.
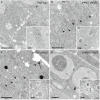
- A, B
The ultrastructure of cytokinetic defects was analyzed by transmission electron microscopy of 5‐day‐old root tip meristems. Images shown are from three roots (wild type) and seven roots (pi4kβ1 pi4kβ2 double mutant). In wild‐type controls (A), vesicles fused at the cell division plane to give rise to the tubular network (TN) of a nascent cell plate. White arrowheads, fused vesicles at the division plane. n = 8 cells. In the pi4kβ1 pi4kβ2 double mutant (B), vesicles were delivered to the cell division plane at a similar stage as wild type but did not fuse. The nuclei of both wild‐type and double mutant cells were at telophase or interphase, as judged by the presence of decondensed chromatin and a nuclear envelope. At this stage, failed cell plate formation was never seen in wild type (A). Black arrowheads, unfused vesicles. n = 6 cells.
- C
Unfused vesicles clustered around a cell wall stub (arrow). White arrowheads, light vesicles; black arrowheads, dark vesicles; black arrow, cell wall stub. n = 8 cells.
- D
No cross‐wall was seen in this cell with two nuclei. n = 6 cells.
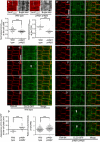
- A
Top: Cell plate‐associated fluorescence of the PtdIns(4)P reporter, 2×mCherryFAPP1‐PH, was monitored at the end of cytokinesis in 5‐day‐old wild‐type controls or pi4kβ1 pi4kβ2 double mutants, as indicated. Scale bars, 10 μm. Bottom: The intensity of 2×mCherryFAPP1‐PH signals was quantified at the end of cytokinesis at the cell plate (left plot) and at the TGN (right plot). Signal intensities at the cell plate were recorded along the dashed lines indicated in the images and normalized to intensities at the apical plasma membrane (wild type, n = 37 cells, 24 roots; pi4kβ1 pi4kβ2, n = 55 cells, 41 roots). TGN intensities were recorded using the Airyscan VP mode, and the mean TGN intensity was normalized to mean apical and basal plasma membrane intensity (wild type, n = 30 cells, 22 roots; pi4kβ1 pi4kβ2, n = 37 cells, 31 roots). ***, significant differences (P < 0.0001) according to two‐tailed Mann–Whitney U‐tests.
- B, C
Image series from live‐cell time‐lapse analysis of CLC2‐GFP at the cell plate in roots of wild‐type or pi4kβ1 pi4kβ2 seedlings costained with FM 4‐64, as indicated. Arrowheads, appearance of CLC2‐GFP at the cell plate. Times are given relative to the instance when the cell plate contacted the peripheral plasma membrane, defined as t0. Scale bars, 10 μm. Images are from median focal planes chosen from time‐lapse series recorded as 3D stacks. 3D projections of the t0 images for wild type and double mutant and results for CLC2‐recruitment based on immunostaining can be seen in Appendix Fig S6.
- D
Left, quantification of the time of CLC2‐GFP appearance at the cell plate in wild type (B) or the pi4kβ1 pi4kβ2 double mutant (C) (wild type, n = 10 cells, 7 roots; pi4kβ1 pi4kβ2, n = 24 cells, 19 roots). Right, quantification of CLC2‐GFP at the TGN in interphase cells. Five‐day‐old roots expressing CLC2‐GFP were subjected to immunostaining, and the mean TGN intensity was normalized to plasma membrane intensity (wild type, n = 14 cells, 2 roots; pi4kβ1 pi4kβ2, n = 15 cells, 2 roots). ***, a significant difference (P < 0.0001) according to a two‐tailed Student's t‐test.
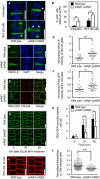
Five‐day‐old seedlings were immunostained with anti‐KNOLLE (green) and counterstained with DAPI (blue). In the pi4kβ1 pi4kβ2 double mutant, diffusion of KNOLLE occurred at the plasma membrane (arrowheads). Scale bars, 10 μm.
Quantitative analysis of lateral diffusion of KNOLLE at the plasma membrane (PM) from (A). Data are mean ± SD from four independent experiments. **, a significant difference (P < 0.01) according to a two‐tailed Student's t‐test (untreated wild type, n = 97 cells, 25 roots; untreated pi4kβ1 pi4kβ2, n = 142 cells, 44 roots; BFA‐treated wild type, n = 126 cells, 28 roots; BFA‐treated pi4kβ1 pi4kβ2, n = 183 cells, 43 roots).
Enhanced accumulation of KNOLLE at the cell plate at the end of cytokinesis in the pi4kβ1 pi4kβ2 double mutant. Five‐day‐old seedlings were immunostained with anti‐KNOLLE antibodies (green) and counterstained with DAPI (blue). Scale bars, 10 μm.
Quantification of KNOLLE intensity at the cell plate from (C), normalized to the signal intensity of intracellular compartments. ***, a significant difference (P < 0.0001) according to a two‐tailed Mann–Whitney U‐test (wild type, n = 26 cells, 20 roots; pi4kβ1 pi4kβ2, n = 41 cells, 37 roots).
Enhanced accumulation of PIN2‐GFP at the cell plate at the end of cytokinesis in the pi4kβ1 pi4kβ2 double mutant. Five‐day‐old seedlings were stained with 2 μM FM 4‐64 for 3 min at room temperature. Scale bars, 10 μm.
Quantification of PIN2‐GFP signal at the cell plate from (E), normalized to the intensity at the apical plasma membrane intensity, as indicated by the dashed lines. ***, a significant difference (P < 0.001) according to a two‐tailed Mann–Whitney U‐test (wild type, n = 28 cells, 16 roots; pi4kβ1 pi4kβ2, n = 45 cells, 26 roots).
Internalization of PIN2‐GFP was tracked over time in live roots pretreated with 50 μM CHX for 30 min, then washed, and incubated with 50 μM CHX and 25 μM BFA. Scale bars, 10 μm.
Quantification of punctate signals from (G) induced by BFA in wild type and pi4kβ1 pi4kβ2 double mutants. Data are mean ± SD. *, a significant difference (P < 0.05) according to a two‐tailed Student's t‐test (wild type, n = 116 cells, 6 roots; pi4kβ1 pi4kβ2, n = 110 cells, 7 roots).
Delayed internalization of FM 4‐64 from the plasma membrane in the pi4kβ1 pi4kβ2 double mutant. Four‐day‐old seedlings were pulsed with 2 μM FM 4‐64 for 3 min on ice, and then, fluorescence was recorded for 20 min. Scale bars, 10 μm.
Quantification of intracellular FM 4‐64 signal from (i), normalized to apical and basal plasma membrane intensities. ***, a significant difference (P < 0.0001) according to a two‐tailed Mann–Whitney U‐test (wild type, n = 116 cells, 6 roots; pi4kβ1 pi4kβ2, n = 66 cells, 9 roots).
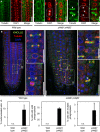
Immunostaining of meristem cells of 5‐day‐old plants using anti‐tubulin (green) counterstained with DAPI (false color red). Asterisks, multiple nuclei in one cell; arrowheads, multiple phragmoplasts in one cell. Dashed lines indicate the outlines of exemplary multinucleated cells. Scale bars, 10 μm.
Whole‐mount immunostaining of root tips of 5‐day‐old seedlings. Green, anti‐KNOLLE; red, anti‐tubulin; blue, DAPI. (I), (II), magnifications of areas highlighted in dashed boxes. Arrowheads, solid phragmoplasts with thicker cell plates. Scale bars, 20 μm.
Quantification of the incidences of multinucleated cells, multiple phragmoplasts, and solid phragmoplasts during late cytokinesis (multinucleated cells: wild type, n = 316 cells, 29 roots; pi4kβ1 pi4kβ2, n = 673 cells, 44 roots; multiple phragmoplasts: wild type, n = 64 cells, 29 roots; pi4kβ1 pi4kβ2, n = 188 cells, 44 roots; solid phragmoplast in late cytokinesis: wild type, n = 41 cells, 29 roots; pi4kβ1 pi4kβ2, n = 89 cells, 44 roots). Data are mean ± SD from three independent experiments. n.d., not detected.
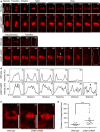
Five‐day‐old seedlings expressing mCherry‐TUA5 were imaged at 1 frame per 2 min. Times are given relative to the instance when the cell plate contacted the peripheral plasma membrane, defined as t0. Cells are outlined by dashed lines in the first and last frames of each series. White arrowhead, ectopic stabilization of microtubules in central phragmoplasts of the pi4kβ1 pi4kβ2 double mutant. Scale bars, 10 μm.
Plot profiles obtained from dashed lines marked in (A). Black arrowhead, ectopic stabilization of microtubules in central phragmoplasts of the pi4kβ1 pi4kβ2 double mutant.
3D projections from time points selected from (A), when the transition to a ring phragmoplast has occurred in wild type, but solid phragmoplast persisted in the double mutant. Scale bars, 10 μm.
Duration of phragmoplast persistence during cytokinesis, determined from initiation to disbanding. ***, a significant difference (P < 0.001) according to a two‐tailed Mann–Whitney U‐test (wild type, n = 12 cells, 9 roots; pi4kβ1 pi4kβ2, n = 21 cells, 16 roots).
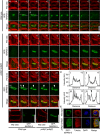
Image series of 3D projections of GFP‐MAP65‐3 costained with FM 4‐64 in root tips of 4‐day‐old wild‐type seedlings. The best angle for visualization was obtained by rotation of the x‐axis. Images are representative for 8 cells from 5 roots. Scale bar, 10 μm.
Image series of 3D projections of GFP‐MAP65‐3 costained with FM 4‐64 in root tips of 4‐day‐old pi4kβ1 pi4kβ2 seedlings. The best angle for visualization was obtained by rotation of the x‐axis. Images are representative for 11 cells from 10 roots. Arrowheads, persisting signal of GFP‐MAP65‐3 in the center of the cell division plane. Scale bars, 10 μm.
Plot profiles were obtained from medial confocal planes at time points displaying the transition from disk to ring phragmoplasts, marked by dashed lines in (A) and (B). Arrowhead, persisting signal of GFP‐MAP65‐3 in the center of the cell division plane.
Medial confocal planes from z‐stacks from (A) and (B) demonstrating attachment of the FM 4‐64‐stained cell plate with the peripheral plasma membrane, defining t0. Scale bars, 10 μm.
3D reconstruction of ring‐ and disk‐shaped immunofluorescence patterns for GFP‐MAP65‐3 and microtubules, based on super‐resolution structured illumination microscopy (SIM), costained with DAPI. Top panels, wild type; bottom panels, pi4kβ1 pi4kβ2 double mutants. Scale bars, 10 μm.
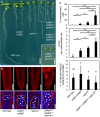
Crosses of pi4kβ1 pi4kβ2 and mpk4‐2 mutants resulted in combined genotypes with increased growth defects, as indicated. Fourteen‐day‐old seedlings are shown. Scale bars, 1 cm.
Top: The severe growth defects of the combined genotypes were accompanied by increased tissue distortion, as shown by 3D projections after propidium iodide staining of root tips of 14‐day‐old seedlings. Scale bars, 100 μm. Bottom: Multinucleation of cells was increased in the combined genotypes, as evident from immunofluorescence of microtubules (red) counterstained with DAPI (blue). Asterisks, multiple nuclei in one cell. Dashed lines indicate the outlines of exemplary multinucleated cells. Scale bars, 10 μm.
Quantification of cytokinetic defects, as shown in the bottom panels of (B). Cytokinetic defects were enhanced in pi4kβ1 (−/−) pi4kβ2 (+/−) mpk4‐2 (−/−) (for multinucleated cells, including the percentage of multinucleated cells and the average number of nuclei in multinucleated cells, both according to a Welch ANOVA with Games‐Howell post hoc test; ***P < 0.001; **P < 0.01 (wild type, n = 1,650 cells, 13 roots; pi4kβ1 pi4kβ2, n = 1,441 cells, 19 roots; mpk4‐2, n = 1,429 cells, 16 roots; pi4kβ1 (−/−) pi4kβ2 (+/−) mpk4‐2 (−/−), n = 574 cells, 16 roots); and the incidence of cells displaying KNOLLE fluorescence at the cell plate according to a one‐way ANOVA with post hoc Tukey HSD; P < 0.05, lowercase letters (wild type, n = 1,981 cells, 13 roots; pi4kβ1 pi4kβ2, n = 1,758 cells, 19 roots; mpk4‐2, n = 1,721 cells, 16 roots, pi4kβ1 (−/−) pi4kβ2 (+/−) mpk4‐2 (−/−), n = 660 cells, 16 roots).
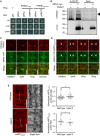
PI4Kβ1 interacts with MPK4 in yeast two‐hybrid tests. MPK4 was used as a bait, while PI4Kβ1 was divided into two fragments to be used as prey. The results are representative for three independent experiments.
In vivo co‐immunoprecipitation of MPK4 and PI4Kβ1 from 14‐day‐old plants. PI4Kβ1 was specifically co‐precipitated with MPK4‐myc using anti‐myc antibodies. Arrowhead, Migration of PI4Kβ1. The results are representative for three independent experiments.
Coordination of MPK4‐YFP and mCherry‐PI4Kβ1 during cytokinesis in 5‐day‐old root meristem cells. MPK4 co‐localized with PI4Kβ1 from early to late cytokinesis and gradually concentrated at the leading edges of cell plates. Images were obtained with an LSM880 in Airyscan super‐resolution (SR) mode. Scale bars, 10 μm.
Live‐cell time lapse of MPK4‐YFP and mRFPFAPP1‐PH during cytokinesis, obtained with an LSM880 in Airyscan resolution versus sensitivity (R‐S) mode. The time series is representative for six cells from five roots. Arrowheads indicate the initiation and leading edges of the growing cell plate. Scale bar, 10 μm.
Left panels: The distribution of mRFPFAPP1‐PH was observed at the cell plate at the end of cytokinesis in root meristem cells of wild‐type controls (top) and mpk4‐2 mutants (bottom). Intensity profiles were recorded as indicated by the dashed lines. Scale bars, 10 μm. Right top, intensity of mRFPFAPP1‐PH at the cell plate normalized vs. the intensity at the apical plasma membrane (wild type, n = 43 cells, 34 roots; mpk4‐2, n = 32 cells, 28 roots). Right bottom, intensity of mRFPFAPP1‐PH at the TGN normalized vs. the intensity at the apical plasma membrane (wild type, n = 40 cells, 29 roots; mpk4‐2, n = 26 cells, 23 roots). *, a significant difference (P < 0.05) according to a two‐tailed Student's test.
References
-
- Antignani V, Klocko AL, Bak G, Chandrasekaran SD, Dunivin T, Nielsen E (2015) Recruitment of PLANT U‐BOX13 and the PI4Kβ1/β2 phosphatidylinositol‐4 kinases by the small GTPase RabA4B plays important roles during salicylic acid‐mediated plant defense signaling in Arabidopsis . Plant Cell 27: 243–261 - PMC - PubMed
-
- Balla T, Bondeva T, Varnai P (2000) How accurately can we image inositol lipids in living cells? Trends Pharmacol Sci 21: 238–241 - PubMed
-
- Beck M, Komis G, Ziemann A, Menzel D, Šamaj J (2011) Mitogen‐activated protein kinase 4 is involved in the regulation of mitotic and cytokinetic microtubule transitions in Arabidopsis thaliana . New Phytol 189: 1069–1083 - PubMed
Publication types
MeSH terms
Substances
LinkOut - more resources
Full Text Sources
Other Literature Sources
Molecular Biology Databases

