. 2019 Feb 1;132(3):jcs223883.
doi: 10.1242/jcs.223883.

GPN does not release lysosomal Ca2+ but evokes Ca2+ release from the ER by increasing the cytosolic pH independently of cathepsin C

Affiliations

GPN does not release lysosomal Ca2+ but evokes Ca2+ release from the ER by increasing the cytosolic pH independently of cathepsin C

Peace Atakpa et al. J Cell Sci. .

Abstract

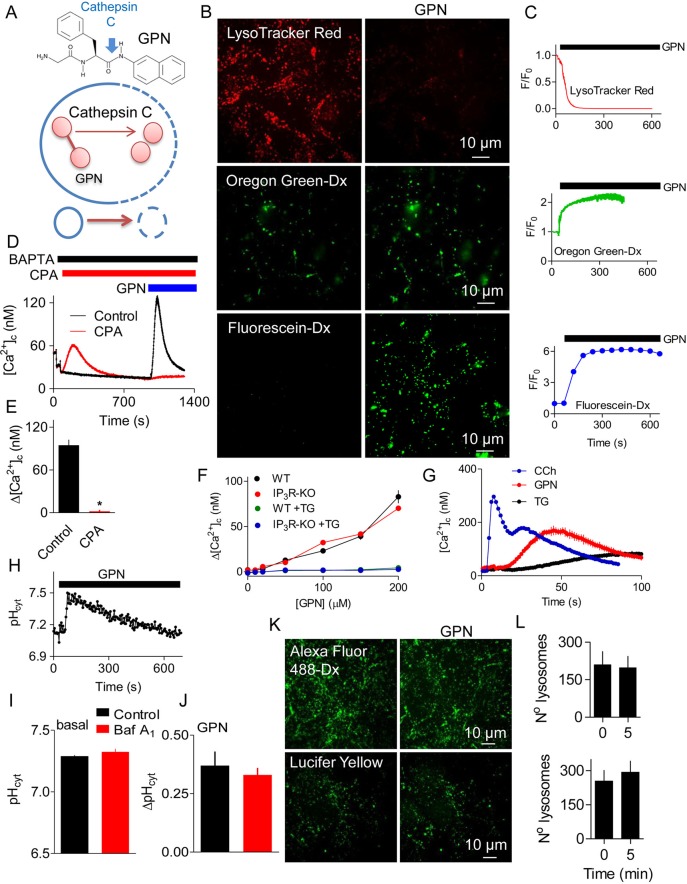
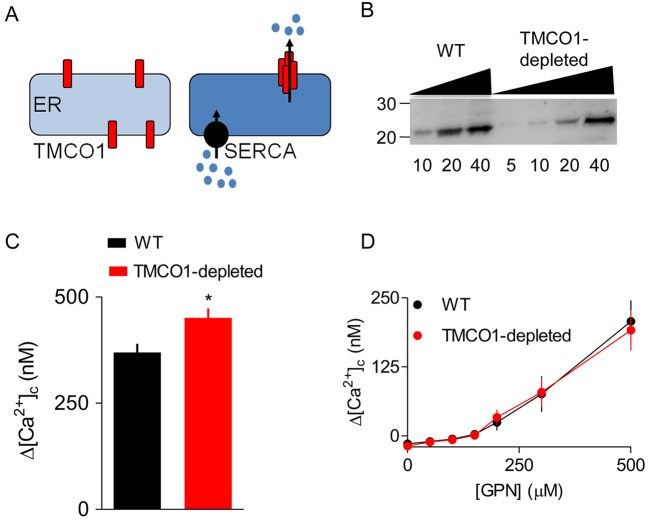
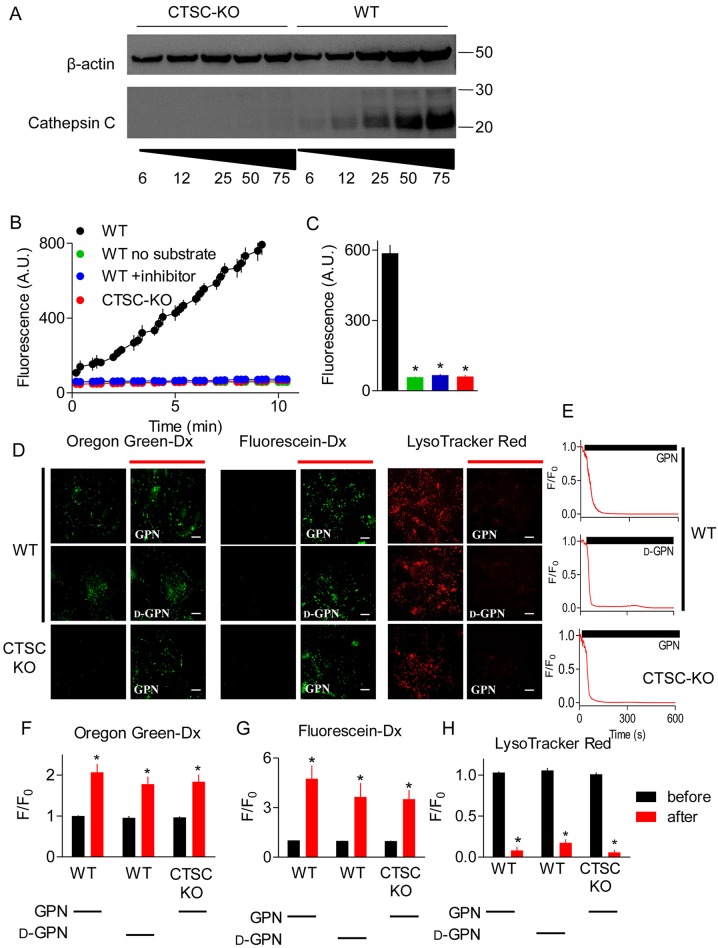
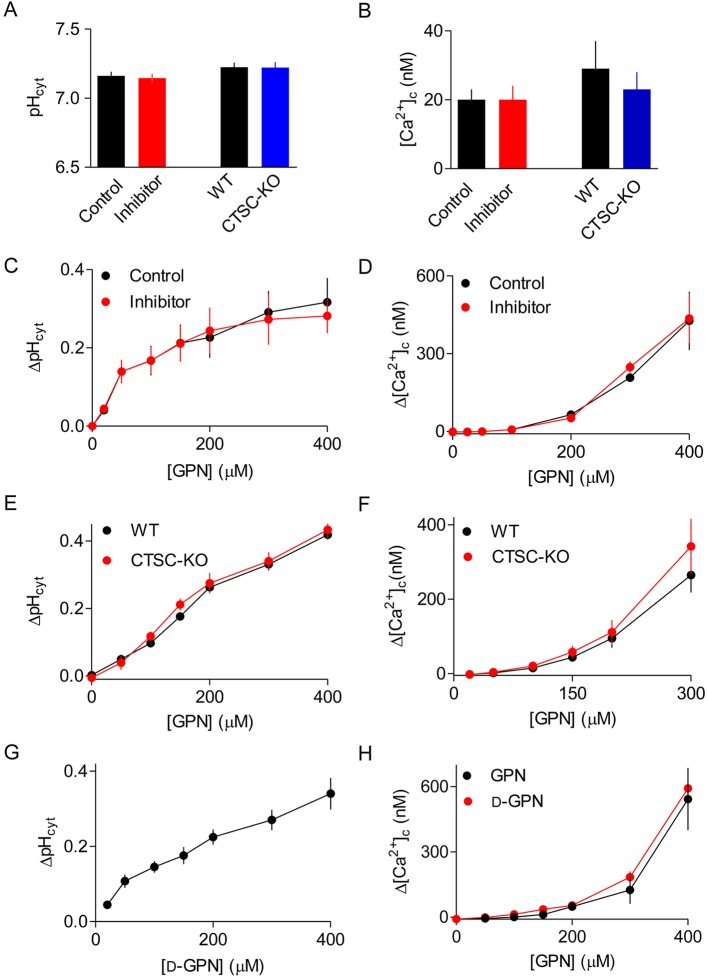
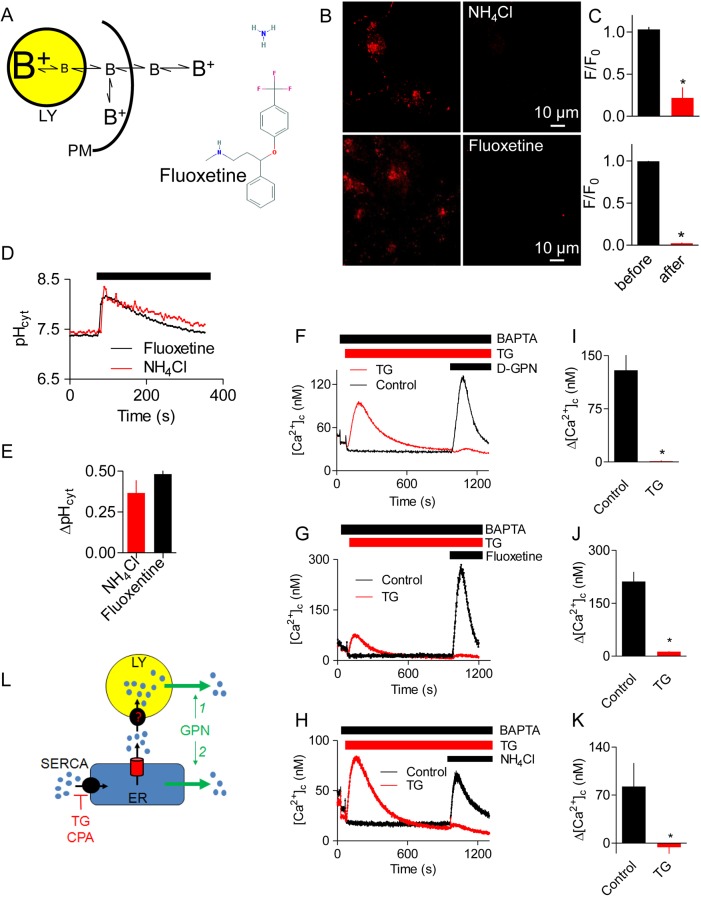
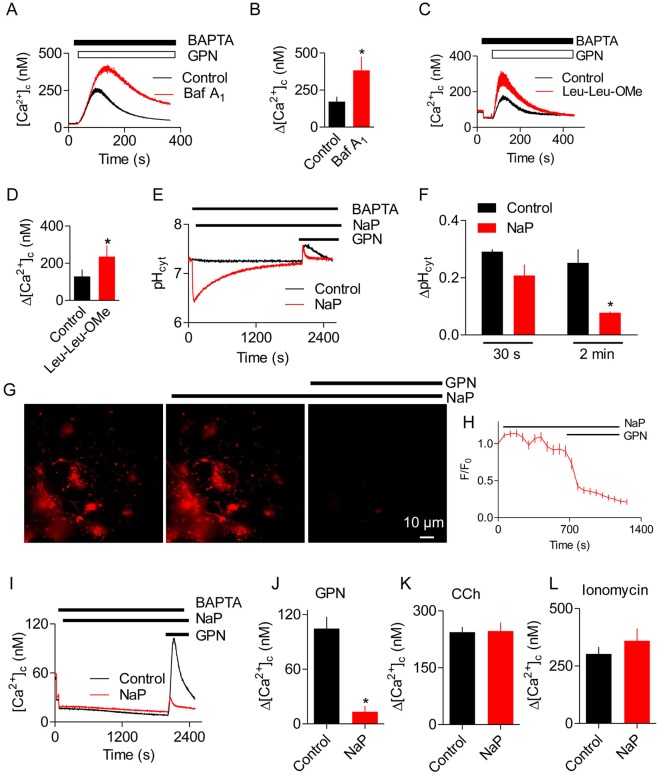
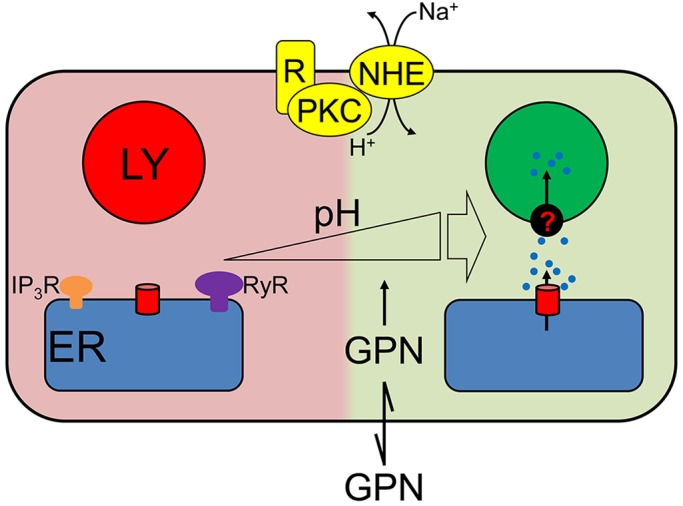
The dipeptide glycyl-l-phenylalanine 2-naphthylamide (GPN) is widely used to perturb lysosomes because its cleavage by the lysosomal enzyme cathepsin C is proposed to rupture lysosomal membranes. We show that GPN evokes a sustained increase in lysosomal pH (pHly), and transient increases in cytosolic pH (pHcyt) and Ca2+ concentration ([Ca2+]c). None of these effects require cathepsin C, nor are they accompanied by rupture of lysosomes, but they are mimicked by structurally unrelated weak bases. GPN-evoked increases in [Ca2+]c require Ca2+ within the endoplasmic reticulum (ER), but they are not mediated by ER Ca2+ channels amplifying Ca2+ release from lysosomes. GPN increases [Ca2+]c by increasing pHcyt, which then directly stimulates Ca2+ release from the ER. We conclude that physiologically relevant increases in pHcyt stimulate Ca2+ release from the ER in a manner that is independent of IP3 and ryanodine receptors, and that GPN does not selectively target lysosomes.

Keywords: Ca2+ signals; Cathepsin C; Cytosolic pH; Endoplasmic reticulum; GPN; Lysosome.


Conflict of interest statement

Competing interestsThe authors declare no competing or financial interests.

Figures

Fig. 1.
Fig. 1.
GPN changes pH and [Ca2+]c without rupturing lysosomes. (A) GPN is proposed to disrupt lysosomes because its cleavage by cathepsin C (blue arrow) causes osmotic lysis. (B) HEK cells loaded with LysoTracker Red, or with dextran conjugates of Oregon Green or fluorescein report an increase in pHly after addition of GPN (200 µM for 200 s). Increased pH causes fluorescence to decrease for LysoTracker Red and increase for the other indicators. (C) Time courses of GPN-evoked changes in fluorescence (F/F0) of the pHly indicators. Each trace shows mean±s.d. from 3–4 ROIs in a single cell (summarised in Fig. 3F,H). (D) BAPTA (2.5 mM) was added to chelate extracellular Ca2+, and cyclopiazonic acid (CPA, 20 µM) to inhibit SERCAs, before the addition of GPN (200 µM) to fluo 8-loaded HEK cells. Results show mean±s.d. for 3 replicates. (E) Summary results (mean±s.e.m., n=3) from analyses similar to those in panel D show peak increase in [Ca2+]c (Δ[Ca2+]c) evoked by GPN. *P<0.05, Student's t-test. (F) Wild-type HEK cells (WT) or HEK cells without IP3Rs (IP3R-KO) kept in Ca2+-free HBS were either stimulated with 200 µM GPN alone or treated with 1 µM thapsigargin (TG) for 15 min followed by addition of 200 µM GPN. Results (mean±s.e.m., n=4, with 3 replicates) show Δ[Ca2+]c. The green symbols are obscured by the overlying blue symbols. (G) Initial responses of HEK cells to carbachol (CCh, 1 mM), GPN (200 µM) or thapsigargin (TG, 1 µM) in Ca2+-free HBS (mean±s.d. of 3 replicates). A summary of these data is shown in Fig. S1C,D. (H) Effect of GPN (200 µM) on pHcyt determined using the pH indicator SNARF-5F in populations of HEK cells. (I,J) Effects of bafilomycin A1 (Baf A1, 1 µM, 1 h) on basal pHcyt (I) and on the ΔpHcyt evoked by GPN (200 µM, 200 s) (J). Results (mean±s.e.m., n=5, each with 3 replicates) show no significant effect of BafA1 (Student's t-test). (K) Representative confocal images show that GPN (200 µM, 10 min) had no effect on the punctate distribution of endocytosed Lucifer Yellow (Mr 447) or Alexa Fluor 488-coupled dextran (Mr ∼10,000). (L) Number of lysosomes identified before (0 min) and 5 min after GPN addition in at least 3 cells per coverslip. Mean±s.e.m., n=3 independent coverslips (Alexa Fluor 488-Dx, top graph) and n=4 independent coverslips (Lucifer Yellow, bottom graph).
Fig. 2.
Fig. 2.
CICR mediated by TMCO1 does not contribute to GPN-evoked increases in [Ca2+]c. (A) TMCO1 has been proposed to oligomerise into a functional Ca2+-permeable channel as the ER loads with Ca2+ (Wang et al., 2016). Hence, TMCO1 might be able to mediate CICR because Ca2+ released by other intracellular channels fuels ER Ca2+ uptake by SERCAs, leading to Ca2+ overload and opening of TMCO1. (B) Typical western blot showing expression of TMCO1 in HEK cells in which CRISPR/Cas9 was used to achieve a partial knockdown of TMCO1 (67±14%, n=4, mean±s.d.). Molecular mass markers (kDa) and protein loadings (μg) are shown. (C,D) Peak Ca2+ signals evoked by a maximally effective concentration of carbachol (C) or the indicated concentrations of GPN (D) in Ca2+-free HBS (mean±s.e.m., n=3). *P<0.05, Student's t-test.
Fig. 3.
Fig. 3.
Effects of GPN on pHly do not require cathepsin C. (A) Western blot shows expression of cathepsin C and β-actin in wild-type (WT) HEK cells and after CRISPR/Cas9-mediated disruption of the cathepsin C genes (CTSC-KO). Protein loadings (µg) and positions of molecular mass markers (kDa) are shown. A representative for five similar blots is shown. (B) Cathepsin C activity, determined using a substrate (Gly-Arg-AMC) that fluoresces after proteolysis, was determined using whole-cell lysates from WT or CTSC-KO cells, alone or after treatment of cells with the cathepsin C inhibitor Gly-Phe-DMK (10 μM, 72 h, 37°C). Results show mean±s.d. for duplicate determinations. The green symbols are obscured by the overlying blue symbols. (C) Summary results (mean±s.e.m., n=3) from analyses similar to those in panel B show fluorescence recorded after 7 min. *P<0.05, one-way ANOVA, with Tukey's multiple comparison test (see panel B for colour key). (D) Lysosomes of WT or CTSC-KO HEK cells were loaded with pH indicators by endocytosis of dextran conjugates (Oregon Green and fluorescein) or by incubation with LysoTracker Red (100 nM, 20 min). Fluorescence was recorded before or 200 s after addition of GPN or d-GPN (300 µM each). Scale bars: 10 μm. (E) Time courses of the changes in LysoTracker Red fluorescence (F/F0) after addition of GPN or d-GPN (solid bars) in WT and CTSC-KO cells. (F-H) Summary results (mean±s.e.m., n=5) from analyses similar to those in panel E show the fluorescence changes (F/F0) before and 200 s after addition of the indicated GPN (300 µM). *P<0.05, Student's t-test relative to before GPN-treatment.
Fig. 4.
Fig. 4.
Effects of GPN on pHcyt, pHly and [Ca2+]c do not require cathepsin C. (A,B) Effects of the cathepsin C inhibitor Gly-Phe-DMK (10 µM, 72 h) and comparison of WT with CTSC-KO cells on pHcyt (A) and [Ca2+]c (B) of unstimulated HEK cells. Matched controls (Control or WT) are shown for each comparison (inhibitor or CTSC-KO). (C,D) Effects of the cathepsin C inhibitor (Gly-Phe-DMK, 10 µM, 72 h) on the changes in pHcyt (ΔpHcyt, measured 30 s after GPN addition) and the peak increase in [Ca2+]c (Δ[Ca2+]c) evoked by GPN. (E,F) Results of analyses similar to those shown in C,D, comparing the effects of GPN in WT and CTSC-KO cells. (G,H) Results of analyses similar to those shown in C,D, comparing the effects of GPN and d-GPN. Results (A-H) show means±s.e.m., n=3, each with 3 replicates.
Fig. 5.
Fig. 5.
Other weak bases evoke ER-dependent Ca2+ signals. (A) Structures and mechanisms of action of some lysosomotropic drugs. (B) Confocal images of HEK cells loaded with LysoTracker Red (100 nM, 20 min) and then treated (200 s) with NH4Cl (20 mM) or fluoxetine (300 μM). (C) Quantification of fluorescence (F/F0) from images similar to those in panel B. Results show mean±s.e.m., n=7. F0 and F are fluorescence recorded before and 200 s after the addition of NH4Cl or fluoxetine. (D) Effects of NH4Cl (20 mM) or fluoxetine (300 μM) on pHcyt recorded in populations of SNARF-5F-loaded HEK cells. Results show mean±s.d. of n=3 determinations. (E) Summary results (mean±s.e.m., n=3, each with 3 replicates) show peak increases in pHcyt (ΔpHcyt). (F-H) Effects of thapsigargin (TG, 1 μM, 15 min) in Ca2+-free HBS on the Ca2+ signals evoked by d-GPN (200 μM) (F), fluoxetine (300 μM) (G) or NH4Cl (20 mM) (H). Results show mean±s.d. of n= 3 determinations. (I-K) Summary results from analyses similar to those in panels F-H show the effects of d-GPN (I), fluoxetine (J) or NH4Cl (K) on Δ[Ca2+]c alone or after treatment with thapsigargin (TG, 1 μM, 15 min). Results show mean±s.e.m., n=3, each with 3 replicates. (L) A requirement for ER Ca2+ for GPN to evoke an increase in [Ca2+]c might reflect a need for the ER to fuel lysosomal Ca2+ uptake (option 1) or a direct action of GPN on the ER (option 2).
Fig. 6.
Fig. 6.
Buffering the GPN-evoked increase in pHcyt abolishes Ca2+ release from the ER. (A) Effects of bafilomycin A1 (Baf A1, 1 μM, 1 h) on the Ca2+ signals evoked by GPN (200 μM) in HEK cells in Ca2+-free HBS. Mean±s.d. of 3 replicates. (B) Summary results (mean±s.e.m., n=4, each with 3 replicates) from analyses similar to those in panel A show peak increases in [ΔCa2+]c evoked by GPN (Δ[Ca2+]c). *P<0.05, Student's t-test. (C) Effects of pre-treating HEK cells with LLOMe (Leu-Leu-OMe; 1 mM, 1 h) on the Ca2+ signals evoked by GPN (200 μM) in Ca2+-free HBS. Mean±s.d. of 3 replicates. (D) Summary results (mean±s.e.m., n=4, each with 3 replicates) from analyses similar to those in panel C show peak increases in [Ca2+]c evoked by GPN (Δ[Ca2+]c). *P<0.05, Student's t-test. (E) HEK cells in Ca2+-free HBS were treated with sodium proprionate (NaP, 30 mM) before addition of GPN (200 μM). Results show pHcyt (mean of 3 replicates). (F) Summary results (mean±s.e.m., n=3, each with 3 replicates) from analyses similar to those in panel E show pHcyt measured 30 s or 2 min after GPN addition. *P<0.05, Student's t-test. (G) Typical images of HEK cells showing the effects of NaP (30 mM, 30 min) and then GPN (200 μM, 30 s) on LysoTracker Red staining. (H) Time-course (mean±s.d., n= 3 cells). (I) Analysis of the effects of NaP and GPN on [Ca2+]c (mean of 3 replicates). (J-L) Summary results [mean±s.e.m., n=4 (J) or n=3 (K,L), each with 3 replicates] from analyses similar to those in panel E show peak Ca2+ signals (Δ[Ca2+]c) evoked by GPN (200 μM), carbachol (CCh, 1 mM) or ionomycin (5 μM) in Ca2+-free HBS. *P<0.05, Student's t-test.
Fig. 7.
Fig. 7.
GPN evokes Ca2+ release from the ER through an increase in pHcyt. GPN, a weak membrane-permeant base, causes pHcyt to transiently increase which directly stimulates Ca2+ release from the ER through a mechanism that requires neither IP3Rs nor RyRs. Some of the Ca2+ released by this pH-regulated mechanism, similarly to Ca2+ released by IP3Rs, is then accumulated by lysosomes (LY). Many physiological stimuli that increase pHcyt, including those that stimulate the Na+/H+ antiporter (NHE) through protein kinase C (PKC), evoke increases in [Ca2+]c through the same pathway.

Similar articles

Cited by

References

    1. Alzayady K. J., Wang L., Chandrasekhar R., Wagner L. E. II, Van Petegem F. and Yule D. I. (2016). Defining the stoichiometry of inositol 1,4,5-trisphosphate binding required to initiate Ca2+ release. Sci. Signal. 9, ra35 10.1126/scisignal.aad6281 - DOI - PMC - PubMed
    1. Atakpa P., Thillaiappan N. B., Mataragka S., Prole D. L. and Taylor C. W. (2018). IP3 receptors associate with ER-lysosome contact sites and selectively deliver Ca2+ to lysosomes. Cell Rep. 25, 3180-3193. 10.1016/j.celrep.2018.11.064 - DOI - PMC - PubMed
    1. Babcock D. F., Rufo G. A. Jr and Lardy H. A. (1983). Potassium-dependent increases in cytosolic pH stimulate metabolism and motility of mammalian sperm. Proc. Natl. Acad. Sci. USA 80, 1327-1331. 10.1073/pnas.80.5.1327 - DOI - PMC - PubMed
    1. Bagshaw R. D., Mahuran D. J. and Callahan J. W. (2005). A proteomic analysis of lysosomal integral membrane proteins reveals the diverse composition of the organelle. Mol. Cell. Proteomics 4, 133-143. 10.1074/mcp.M400128-MCP200 - DOI - PubMed
    1. Batlle D. C., Peces R., LaPointe M. S., Ye M. and Daugirdas J. T. (1993). Cytosolic free calcium regulation in response to acute changes in intracellular pH in vascular smooth muscle. Am. J. Physiol. 264, C932-C943. 10.1152/ajpcell.1993.264.4.C932 - DOI - PubMed

Publication types

MeSH terms