

Hyperglycemia and Adverse Pregnancy Outcome Follow-up Study (HAPO FUS): Maternal Glycemia and Childhood Glucose Metabolism
- PMID: 30617141
- PMCID: PMC6385697
- DOI: 10.2337/dc18-2021
Hyperglycemia and Adverse Pregnancy Outcome Follow-up Study (HAPO FUS): Maternal Glycemia and Childhood Glucose Metabolism
Abstract
Objective: This study examined associations of maternal glycemia during pregnancy with childhood glucose outcomes in the Hyperglycemia and Adverse Pregnancy Outcome (HAPO) cohort.
Research design and methods: HAPO was an observational international investigation that established associations of maternal glucose with adverse perinatal outcomes. The HAPO Follow-up Study included 4,832 children ages 10-14 years whose mothers had a 75-g oral glucose tolerance test (OGTT) at ∼28 weeks of gestation. Of these, 4,160 children were evaluated for glucose outcomes. Primary outcomes were child impaired glucose tolerance (IGT) and impaired fasting glucose (IFG). Additional outcomes were glucose-related measures using plasma glucose (PG), A1C, and C-peptide from the child OGTT.
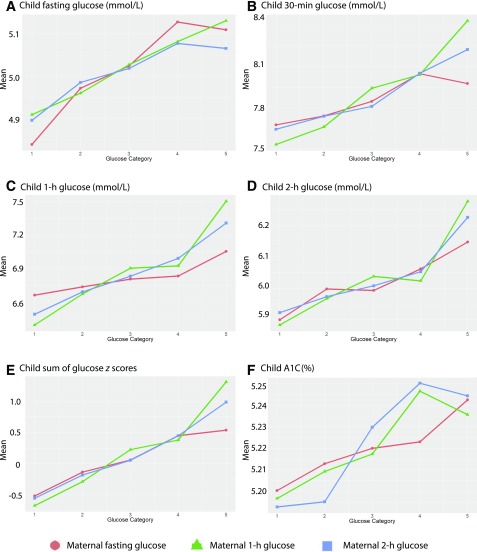
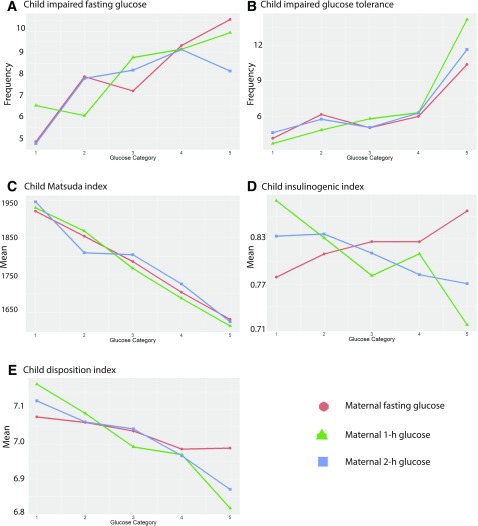
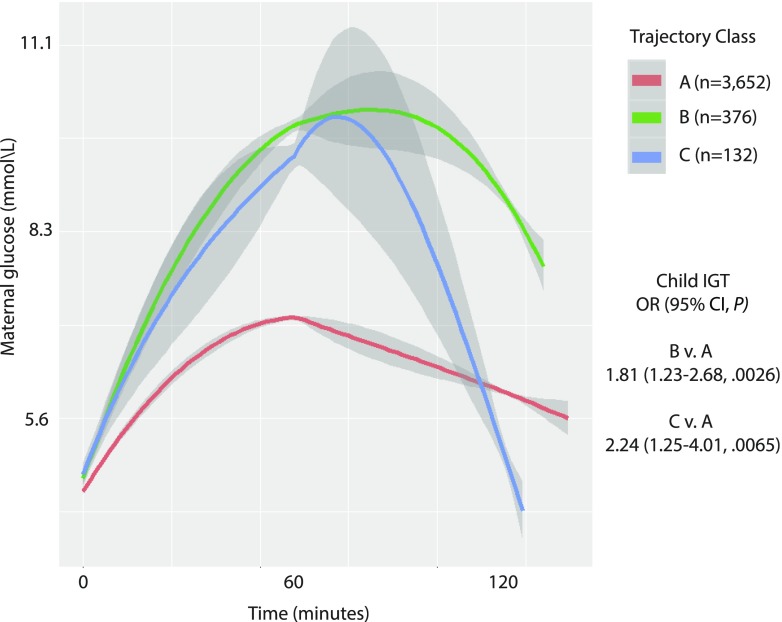
Results: Maternal fasting plasma glucose (FPG) was positively associated with child FPG and A1C; maternal 1-h and 2-h PG were positively associated with child fasting, 30 min, 1-h, and 2-h PG, and A1C. Maternal FPG, 1-h, and 2-h PG were inversely associated with insulin sensitivity, whereas 1-h and 2-h PG were inversely associated with disposition index. Maternal FPG, but not 1-h or 2-h PG, was associated with child IFG, and maternal 1-h and 2-h PG, but not FPG, were associated with child IGT. All associations were independent of maternal and child BMI. Across increasing categories of maternal glucose, frequencies of child IFG and IGT, and timed PG measures and A1C were higher, whereas insulin sensitivity and disposition index decreased.
Conclusions: Across the maternal glucose spectrum, exposure to higher levels in utero is significantly associated with childhood glucose and insulin resistance independent of maternal and childhood BMI and family history of diabetes.
© 2019 by the American Diabetes Association.
Figures
Comment in
-
Much to HAPO FUS About: Increasing Maternal Glycemia in Pregnancy Is Associated With Worsening Childhood Glucose Metabolism.Diabetes Care. 2019 Mar;42(3):393-395. doi: 10.2337/dci18-0064. Diabetes Care. 2019. PMID: 30787060 Free PMC article. No abstract available.
-
Comment on Scholtens et al. Hyperglycemia and Adverse Pregnancy Outcome Follow-up Study (HAPO FUS): Maternal Glycemia and Childhood Glucose Metabolism. Diabetes Care 2019;42:381-392.Diabetes Care. 2019 Jul;42(7):e127. doi: 10.2337/dc19-0650. Diabetes Care. 2019. PMID: 31221712 No abstract available.
-
Response to Comment on Scholtens et al. Hyperglycemia and Adverse Pregnancy Outcome Follow-up Study (HAPO FUS): Maternal Glycemia and Childhood Glucose Metabolism. Diabetes Care 2019;42:381-392.Diabetes Care. 2019 Jul;42(7):e128-e129. doi: 10.2337/dci19-0024. Diabetes Care. 2019. PMID: 31221713 Free PMC article. No abstract available.
References
-
- Hannon TS, Arslanian SA. The changing face of diabetes in youth: lessons learned from studies of type 2 diabetes. Ann N Y Acad Sci 2015;1353:113–137 - PubMed
-
- Viner R, White B, Christie D. Type 2 diabetes in adolescents: a severe phenotype posing major clinical challenges and public health burden. Lancet 2017;389:2252–2260 - PubMed
