. 2019 Mar 21;133(12):1313-1324.
doi: 10.1182/blood-2018-09-871418. Epub 2019 Jan 7.

Genome-wide discovery of somatic coding and noncoding mutations in pediatric endemic and sporadic Burkitt lymphoma

Affiliations

Genome-wide discovery of somatic coding and noncoding mutations in pediatric endemic and sporadic Burkitt lymphoma

Bruno M Grande et al. Blood. .

Abstract

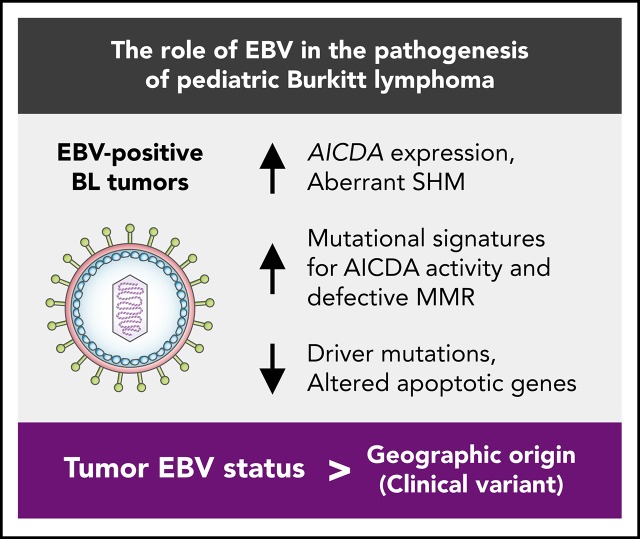
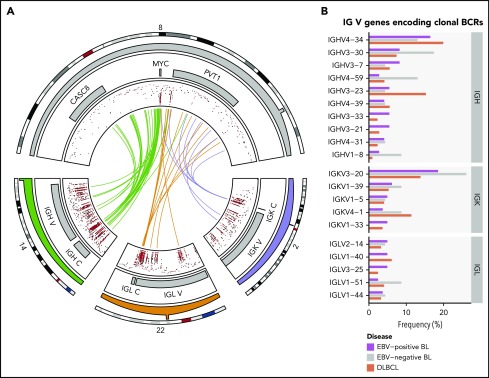
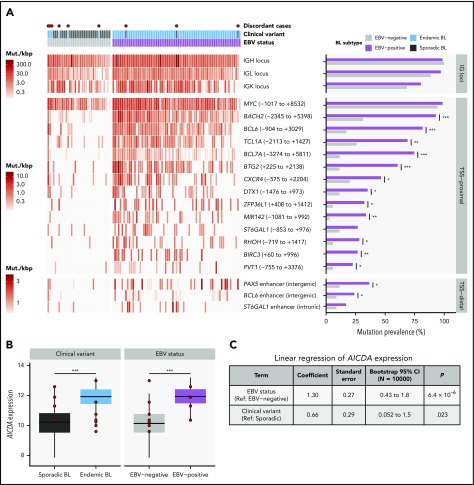
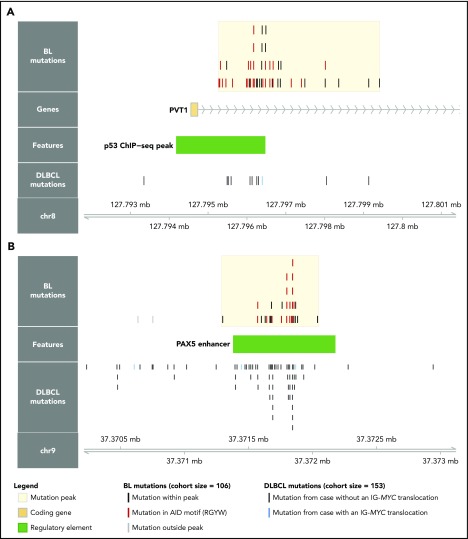
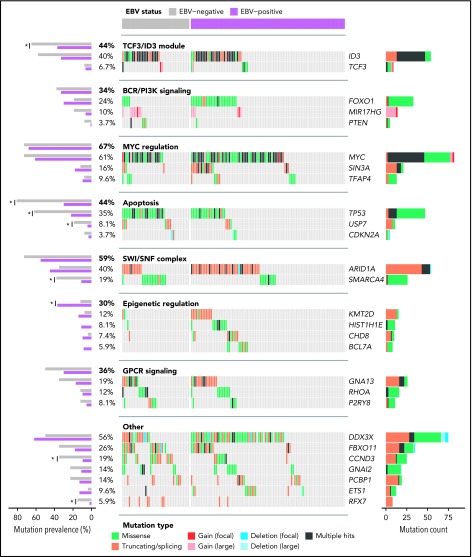
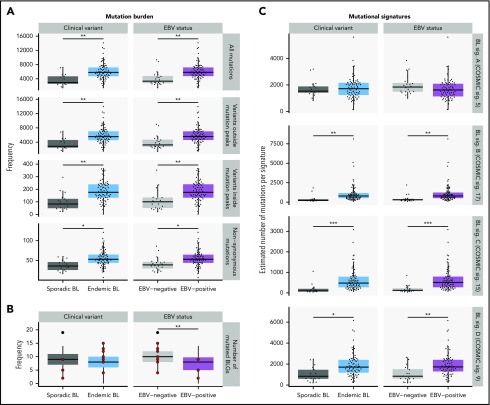
Although generally curable with intensive chemotherapy in resource-rich settings, Burkitt lymphoma (BL) remains a deadly disease in older patients and in sub-Saharan Africa. Epstein-Barr virus (EBV) positivity is a feature in more than 90% of cases in malaria-endemic regions, and up to 30% elsewhere. However, the molecular features of BL have not been comprehensively evaluated when taking into account tumor EBV status or geographic origin. Through an integrative analysis of whole-genome and transcriptome data, we show a striking genome-wide increase in aberrant somatic hypermutation in EBV-positive tumors, supporting a link between EBV and activation-induced cytidine deaminase (AICDA) activity. In addition to identifying novel candidate BL genes such as SIN3A, USP7, and CHD8, we demonstrate that EBV-positive tumors had significantly fewer driver mutations, especially among genes with roles in apoptosis. We also found immunoglobulin variable region genes that were disproportionally used to encode clonal B-cell receptors (BCRs) in the tumors. These include IGHV4-34, known to produce autoreactive antibodies, and IGKV3-20, a feature described in other B-cell malignancies but not yet in BL. Our results suggest that tumor EBV status defines a specific BL phenotype irrespective of geographic origin, with particular molecular properties and distinct pathogenic mechanisms. The novel mutation patterns identified here imply rational use of DNA-damaging chemotherapy in some patients with BL and targeted agents such as the CDK4/6 inhibitor palbociclib in others, whereas the importance of BCR signaling in BL strengthens the potential benefit of inhibitors for PI3K, Syk, and Src family kinases among these patients.


Conflict of interest statement

Conflict-of-interest disclosure: The authors declare no competing financial interests.

Figures

None
Graphical abstract
Figure 1.
Figure 1.
Rearrangements of the immunoglobulin loci in BL. (A) Translocations (shown in center) between the MYC locus (chromosome 8) and the IGH (chromosome 14), IGK (chromosome 2), or IGL (chromosome 22) loci in tumors with WGS data (N = 106). The inner track displays the rainfall plot for simple somatic mutations in these regions. Mutations that overlap AICDA recognition sites (RGYW) are shown in red. (B) Percentage of EBV-positive and EBV-negative BL (N = 117) and DLBCL (N = 323) tumors with RNA-seq data that use the given immunoglobulin V genes to encode their most clonal BCRs (ie, with the highest clonal fraction). V genes that are clonal in fewer than 4 BL tumors are not displayed. Within each group, V genes are ordered from top to bottom on the basis of decreasing overall frequency in the BL cohort.
Figure 2.
Figure 2.
Differential AICDA activity in BL. (A) Left-hand panel shows for each tumor the density of noncoding mutations as mutations per kilobase (mut./kbp) in noncoding mutation peaks annotated with the nearest transcription start site (relative position in parentheses) or regulatory element. Peaks overlapping IG loci are shown separately. Red points indicate discordant cases, which we define as EBV-negative eBLs and EBV-positive sBLs. Right-hand panel compares the mutation prevalence for each peak in EBV-positive and EBV-negative tumors. Significance brackets: *Q < 0.1; **Q < 0.001; ***Q < 0.00001 (Fisher’s exact test). (B) AICDA expression in BL tumor samples stratified on clinical variant status or tumor EBV status (N = 117). Discordant cases, including additional ones from the validation cohort, are highlighted as red points. Significance brackets: ***P < .00001 (Mann-Whitney U test). (C) Linear regression of AICDA expression as a function of tumor EBV status and clinical variant status. This linear model was also bootstrapped 10 000 times to calculate bootstrap 95% confidence intervals (CI). Ref, reference level.
Figure 3.
Figure 3.
Novel targets of aberrant somatic hypermutation in BL. Noncoding mutation peaks overlapping (A) the PVT1 promoter region and (B) a distal PAX5 enhancer. Mutations from the BL discovery cohort (N = 106) and a DLBCL cohort (N = 153) are shown separately.
Figure 4.
Figure 4.
Landscape of nonsynonymous mutations in BL-associated genes. Mutation status of BL-associated genes (BLGs) in the discovery and validation cohorts. EBV-positive (N = 94) and EBV-negative (N = 41) tumors are shown separately and reordered for each pathway to highlight any mutual exclusivity. Mutations are colored according to their predicted consequence on the protein (ie, mutation type) and are tabulated in the right-hand bar plots. Focal gains and deletions were defined as those smaller than 1 Mbp. Mutation prevalence in EBV-positive (N = 94) and EBV-negative (N = 26) BLGSP discovery and validation cases were the ones subject to statistical analysis and are shown in left-hand bar plot. ICGC cases were excluded to avoid the possible confounding effect of lower sequencing coverage. Significance brackets: *Q < 0.1 (Fisher’s exact test).
Figure 5.
Figure 5.
Mutational processes in BL. (A) Mutation frequency is shown for each disease subtype. From top to bottom, the following SSMs are considered in each tumor: all genome-wide SSMs, SSMs outside noncoding mutation peaks, SSMs within peaks, and nonsynonymous SSMs in all protein-coding genes. This analysis was restricted to WGS data from the BLGSP discovery cohort (N = 91). (B) Number of BLGs that are mutated in each BLGSP discovery and validation case (N = 120). All mutation types were considered, as displayed in Figure 4. Discordant cases are highlighted as red points. The number of mutated BLGs was compared using Mann-Whitney U tests (**P < .001). (C) Estimated number of single-nucleotide variants is shown per mutational signature for each disease subtype in the BLGSP discovery cohort (N = 91). The 4 de novo mutational signatures (BL sig.) are annotated with the associated COSMIC reference signature (COSMIC sig.). ICGC cases were excluded to avoid the possible confounding effect of lower sequencing coverage. Significance brackets (panels A and C): *Q < 0.1; **Q < 0.001; ***Q < 0.00001 (Mann-Whitney U test).

Comment in

References

    1. Burkitt D. A sarcoma involving the jaws in African children. Br J Surg. 1958;46(197):218-223. - PubMed
    1. Burkitt D. A “tumour safari” in East and Central Africa. Br J Cancer. 1962;16(3):379-386. - PMC - PubMed
    1. Magrath I. Epidemiology: clues to the pathogenesis of Burkitt lymphoma. Br J Haematol. 2012;156(6):744-756. - PubMed
    1. IARC Working Group on the Evaluation of Carcinogenic Risk to Humans. Epstein-Barr virus and Kaposi's sarcoma herpesvirus/human herpesvirus 8. Lyon, France: International Agency for Research on Cancer; 1997 - PubMed
    1. Costa LJ, Xavier AC, Wahlquist AE, Hill EG. Trends in survival of patients with Burkitt lymphoma/leukemia in the USA: an analysis of 3691 cases. Blood. 2013;121(24):4861-4866. - PMC - PubMed

Publication types

MeSH terms

Substances