. 2019 Mar;29(3):221-232.
doi: 10.1038/s41422-018-0128-1. Epub 2019 Jan 7.

A programmed wave of uridylation-primed mRNA degradation is essential for meiotic progression and mammalian spermatogenesis

Affiliations

A programmed wave of uridylation-primed mRNA degradation is essential for meiotic progression and mammalian spermatogenesis

Marcos Morgan et al. Cell Res. 2019 Mar.

Abstract

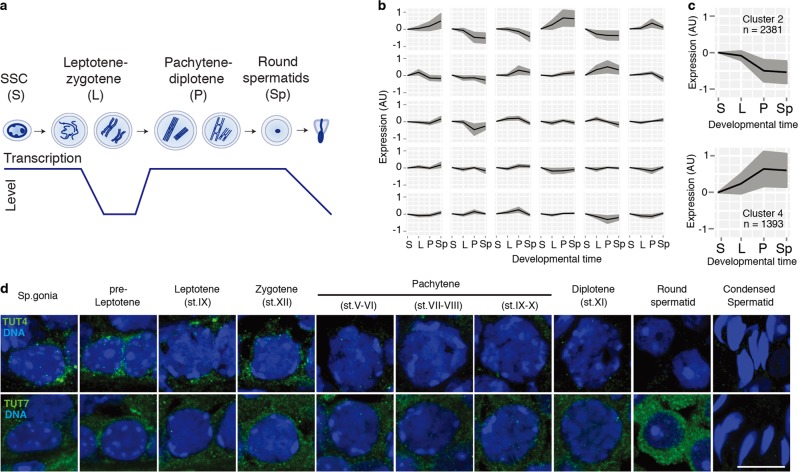
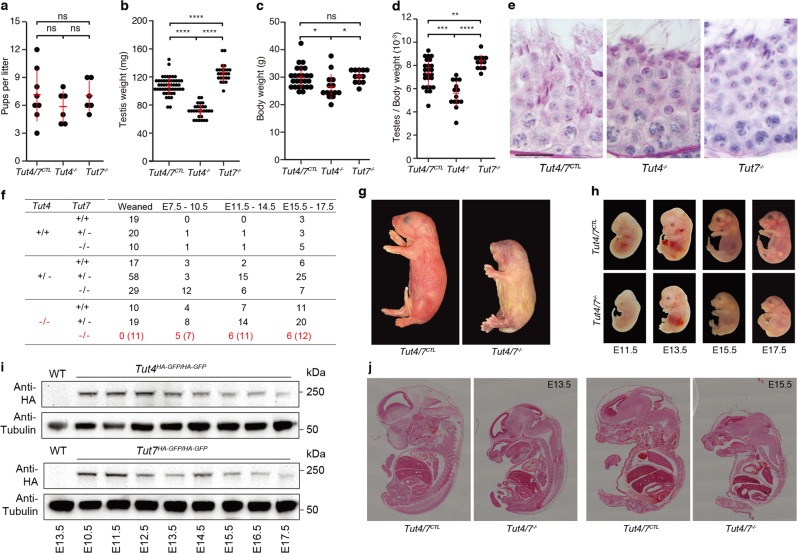
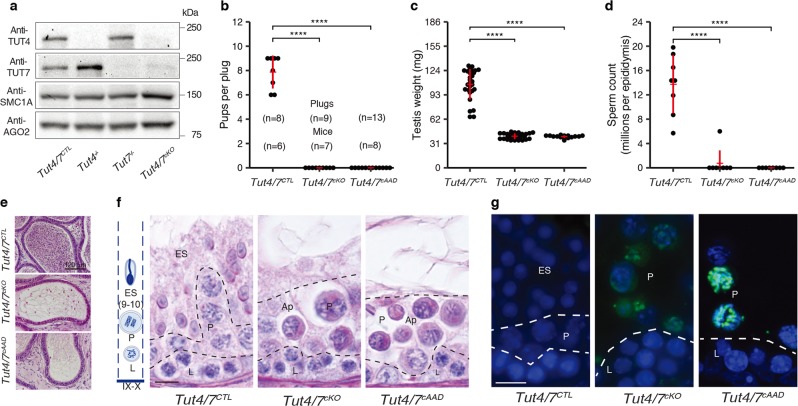
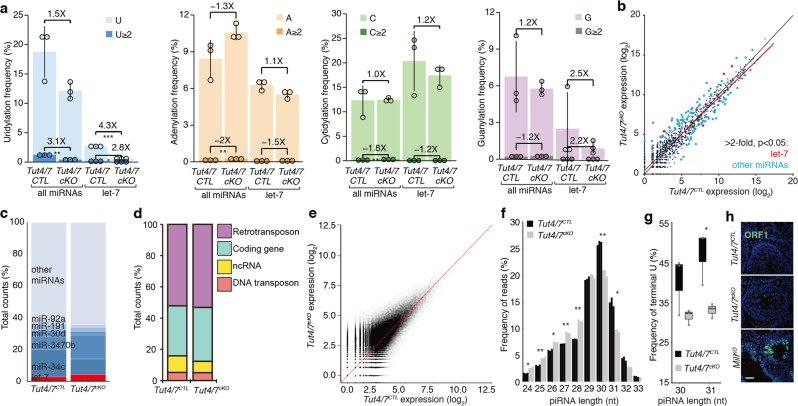
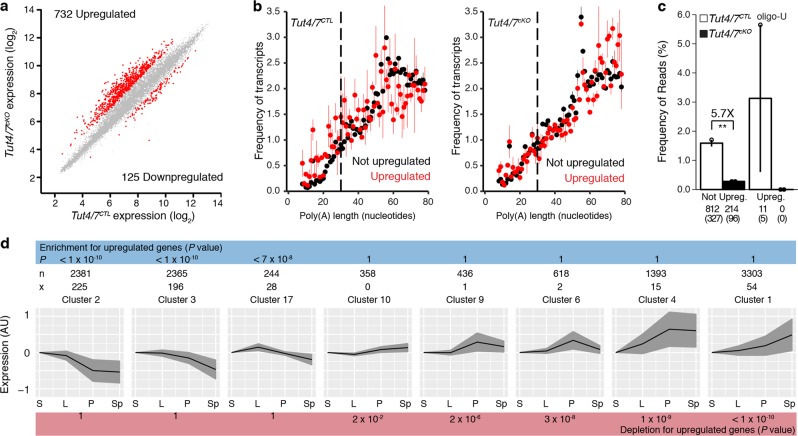
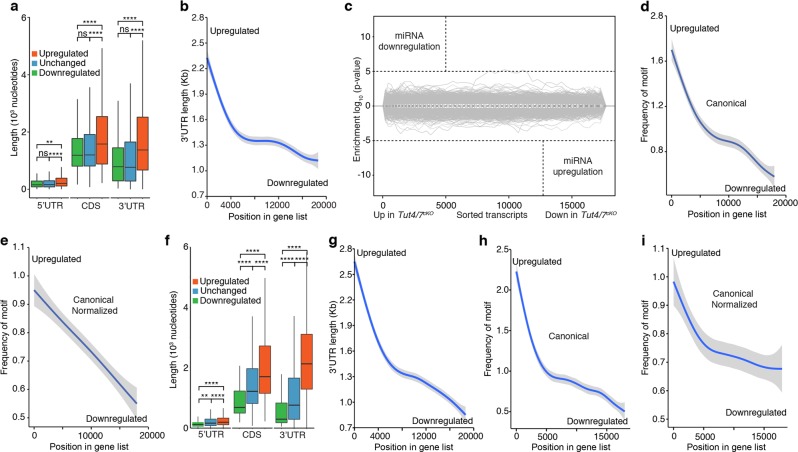
Several developmental stages of spermatogenesis are transcriptionally quiescent which presents major challenges associated with the regulation of gene expression. Here we identify that the zygotene to pachytene transition is not only associated with the resumption of transcription but also a wave of programmed mRNA degradation that is essential for meiotic progression. We explored whether terminal uridydyl transferase 4- (TUT4-) or TUT7-mediated 3' mRNA uridylation contributes to this wave of mRNA degradation during pachynema. Indeed, both TUT4 and TUT7 are expressed throughout most of spermatogenesis, however, loss of either TUT4 or TUT7 does not have any major impact upon spermatogenesis. Combined TUT4 and TUT7 (TUT4/7) deficiency results in embryonic growth defects, while conditional gene targeting revealed an essential role for TUT4/7 in pachytene progression. Loss of TUT4/7 results in the reduction of miRNA, piRNA and mRNA 3' uridylation. Although this reduction does not greatly alter miRNA or piRNA expression, TUT4/7-mediated uridylation is required for the clearance of many zygotene-expressed transcripts in pachytene cells. We find that TUT4/7-regulated transcripts in pachytene spermatocytes are characterized by having long 3' UTRs with length-adjusted enrichment for AU-rich elements. We also observed these features in TUT4/7-regulated maternal transcripts whose dosage was recently shown to be essential for sculpting a functional maternal transcriptome and meiosis. Therefore, mRNA 3' uridylation is a critical determinant of both male and female germline transcriptomes. In conclusion, we have identified a novel requirement for 3' uridylation-programmed zygotene mRNA clearance in pachytene spermatocytes that is essential for male meiotic progression.


Conflict of interest statement

The authors declare no competing interests.

Figures

Fig. 1
Fig. 1
A programmed wave of RNA degradation takes place during the leptotene-zygotene to pachytene transition. a Schematic representation of different spermatogenic transitions. Spermatogonial stem cells (SSC; S), leptotene-zygotene (L), pachytene-diplotene (P), and round spermatids (Sp). Levels of transcriptional activity are indicated below. b Expression change across different spermatogenic transitions as defined in a for clusters of transcripts with similar expression profiles. Clusters were generated using the Markov clustering algorithm. The black line indicates the mean expression of the group, and the gray area indicates the standard deviation. c Expression changes as defined in b for the two clusters showing changes in gene expression during the leptotene-zygotene to pachytene transition (n, number of genes). d Confocal immunofluorescence micrographs of different spermatogenic cell types are shown. Testes from WT animals were stained with an antibody against TUT4 (green), upper panel. Testes from Tut7HA-GFP/HA-GFP mice were stained with an anti-HA antibody (green), lower panel. DNA was stained with Hoechst 33342 (blue). Scale bar, 10 μm
Fig. 2
Fig. 2
TUT4-deficient and TUT7-deficient animals are fertile but combined TUT4/7-deficient animals show growth retardation and die perinatally. a Pups per litter for Tut4/7CTL, Tut4−/, and Tut7−/− males are shown. Each dot corresponds to a single litter. The center value represents the mean, and the error bars the standard deviation. (ns not significant; Wilcoxon test two-sided; Tut4/7CTL, litters = 8, sires = 3; Tut4−/−, litters = 6, sires = 3; Tut7−/−, litters = 6, sires = 3). b Testis weight for Tut4/7CTL, Tut4−/−, and Tut7/– animals. Each dot corresponds to a single testis. The center value represents the mean, and the error bars the standard deviation. (****P< 0.0001, Wilcoxon test two-sided; Tut4/7CTL, n = 50; Tut4/, n = 28; Tut7−/−, n = 24). c Body weight for Tut4/7CTL, Tut4−/−, and Tut7−/− males. Each dot corresponds to the body weight of a single animal. The center value represents the mean, and the error bars the standard deviation. (ns not significant; *P < 0.05, Wilcoxon test two-sided; Tut4/7CTL, n = 25; Tut4−/−, n = 14; Tut7/, n = 12). d Ratio of testes to body weight for Tut4/7CTL, Tut4−/−, and Tut7−/− males. Each dot corresponds to the testes/body weight ratio of a single animal. The center value represents the mean, and the error bars the standard deviation. (**P < 0.05, ***P < 0.01, ****P < 0.001, Wilcoxon test two-sided). e Micrographs of PAS-stained tubule sections from Tut4/7CTL, Tut4−/, and Tut7−/− mice. Scale bar, 20 μm. f Table of pups/embryos observed for different genotypes at different stages of development (weaned, E7.5-10.5, E11.5-14.5, and E15.5-E17.5). The expected numbers of TUT4/7-deficient animals are shown in brackets. g Pictures of P0 Tut4/7CTL and Tut4/7−/ animals are shown. Objective magnification, 1 × . h Pictures of Tut4/7CTL and Tut4/7/ mice at embryonic stages E11.5, E13.5, E15.5, and E17.5 are shown. Objective magnification, 2× for E11.5 and E13.5 embryos and 1× for E15.5 and E17.5 embryos. i Western blots of extracts from WT, Tut4HA-GFP/HA-GFP and Tut7HA-GFP/HA-GFP embryos at different stages of development (E10.5 to E17.5) using anti-HA and anti-Tubulin antibodies. j H&E stained sections of Tut4/7CTL and Tut4/7−/− animals at E13.5 and E15.5 embryonic stages are shown. Objective magnification, 10×
Fig. 3
Fig. 3
TUT4/7 and their uridylation activity are required for male fertility and pachytene progression. a Western blots from whole testes extracts of Tut4/7CTL, Tut4−/−, Tut7−/−, and Tut4/7cKO animals using anti-TUT4, TUT7, AGO2 and SMC1A antibodies. b Pups per plug for Tut4/7CTL, Tut4/7cKO, and Tut4/7cAAD males mated with WT females. The numbers of plugs and sires for each group are indicated. Each dot represents a single litter size. The mean, and standard deviations are indicated in red, together with the groups’ difference significance (****P < 0.001, Wilcoxon test two-sided). c Testis weight of Tut4/7CTL, Tut4/7cKO and Tut4/7cAAD mice. Each dot corresponds to a single testis. The center value represents the mean, and the error bars the standard deviation (****P < 0.001, Wilcoxon test two-sided; Tut4/7CTL, n = 28; Tut4/7cKO, n = 28; Tut4/7cAAD, n = 15). d Sperm count per epididymis of Tut4/7CTL, Tut4/7cKO, and Tut4/7cAAD animals. Each dot corresponds to the sperm count from a single epididymis. The center value represents the mean, and the error bars the standard deviation (****P < 0.001, Wilcoxon test two-sided; Tut4/7CTL, n = 8; Tut4/7cKO, n = 8; Tut4/7cAAD, n= 8). e Sections of epididymis from Tut4/7CTL, Tut4/7cKO, and Tut4/7cAAD animals stained with Hematoxylin and Eosin. Scale bar, 120 μm. f Sections of stage IX-X tubules from Tut4/7CTL, Tut4/7cKO, and Tut4/7cAAD mice stained with the PAS method. The different cell layers are indicated: stages IX-X elongated spermatids (ES), pachytene (P), leptotene (L). Apoptotic cells are also indicated (Ap). On the left, a schematic representation of the different layers found in a stage IX-X tubule is shown. Scale bar, 10 μm. g Tubule sections from Tut4/7CTL, Tut4/7cKO, and Tut4/7cAAD animals stained with TUNEL. DNA was stained with Hoechst 33342 (blue). Scale bar, 10 μm. Cell types are indicated as in f
Fig. 4
Fig. 4
TUT4/7-deficiency has a minor impact on pachytene small RNA pathways. a Frequency of 3′ terminal uridylation (blue), adenylation (orange), cytidylation (green), and guanylation (purple) for all pachytene miRNAs or let-7 miRNAs from Tut4/7CTL and Tut4/7cKO animals. For each group, the frequency of mono- (light) and oligo-nucleotide additions (dark) is shown. The fold change between the different groups is indicated together with the significance (*P < 0.05, **P < 0.01, ***P < 0.001, t-test two-sided; Tut4/7CTL, n = 3; Tut4/7cKO, n = 3). Each dot represents a biological replicate. The heights of the bars indicate the mean value for the different replicates, and the error bars show the standard deviation. b Scatter plot of miRNA expression levels in Tut4/7CTL vs Tut4/7cKO pachytene cells. Let-7 miRNA significantly changing more than two-fold (P < 0.05, Wald test) are highlighted in red. Other miRNAs significantly changing more than two-fold (P < 0.05, Wald test) are highlighted in blue. (Tut4/7CTL, n = 3; Tut4/7cKO, n = 3). The linear regression and the identity line are indicated in red and black, respectively. c Read count frequency of different miRNA families from Tut4/7CTL and Tut4/7cKO pachytene spermatocytes. d Read count frequency of different piRNA deriving from retrotransposons, DNA transposons, coding genes, and other non-coding RNAs (ncRNA) in Tut4/7CTL and Tut4/7cKO pachytene cells. e Scatter plot of all piRNA expression levels in Tut4/7CTL vs Tut4/7cKO pachytene spermatocytes. The identity line is shown in red. f Normalized length distribution of pachytene piRNA from Tut4/7CTL and Tut4/7cKO males. Each bar corresponds to a biological replicate. (*P < 0.05, **P < 0.01, t-test two-sided; Tut4/7CTL, n = 3; Tut4/7cKO, n = 3). g Terminal U frequency for 30 and 31 nucleotide long pachytene piRNAs from Tut4/7CTL and Tut4/7cKO males. Each dot corresponds to a biological replicate. The center value represents the median, and the error bars the range (*P < 0.05, t-test one-sided; Tut4/7CTL, n = 3; Tut4/7cKO, n = 3). h Confocal micrographs of testes sections from Tut4/7CTL, Tut4/7cKO, and MiliKO animals stained with an anti-ORF1 LINE1 antibody (green) are shown. DNA was stained with Hoechst 33342 (blue). Scale bar, 40 μm
Fig. 5
Fig. 5
TUT4/7 are required for clearance of transcripts in pachytene spermatocytes. a Scatter plot of pachytene mRNA expression levels in Tut4/7CTL vs Tut4/7cKO animals. Transcripts significantly changed (P < 0.01 and fold-change >2, Moderated t-statistic adjusted; Tut4/7CTL, n = 4; Tut4/7cKO, n = 3) are highlighted in red. The numbers of significantly upregulated and downregulated genes are indicated. b Poly(A) tail length distribution for pachytene mRNAs from Tut4/7CTL and Tut4/7cKO mice. The distribution is shown for upregulated (red) or not upregulated (black) transcripts. Each dot represents the mean value of two biological replicates and the error bars indicate the range. The dotted vertical line at 30 nucleotides separates short and long tails. c Oligo-uridylation of pachytene mRNAs with short poly(A) tails from Tut4/7CTL and Tut4/7cKO mice. Each dot represents a biological replicate. The height of the bar and the error bars represent the mean and range, respectively. The fold change between groups is indicated together with its significance (**P < 0.01, t-test two-sided; Tut4/7CTL, n = 2; Tut4/7cKO, n = 2). The number of transcripts and genes (in brackets) is shown for each group. d Enrichment analysis of upregulated transcripts in Tut4/7cKO pachytene cells across different clusters of genes group according to their expression across spermatogenesis. The expression profile of each cluster is shown. The black line indicates the mean expression of the group, and the gray area indicates the standard deviation. The number of transcripts in a cluster (n) and the number of upregulated transcripts in that cluster (x) are shown for each cluster. The P values (Hypergeometric test) for enrichment or depletion are also indicated. S spermatogonia stem cells, L leptotene-zygotene, P pachytene-diplotene, Sp round spermatids
Fig. 6
Fig. 6
TUT4/7 target transcripts in pachytene spermatocytes and GV oocytes that are enriched for AU-rich elements in long 3′ UTRs. a Box plot of 5′UTR, CDS and 3′UTR length for downregulated, unchanged and upregulated transcripts in Tut4/7cKO pachytene cells. The center value represents the mean length, and the upper and middle hinges the first and third quartiles, respectively. (ns not significant, **P < 0.01, ****P < 0.0001, Wilcoxon test two-sided). b GAM fit of 3′UTR length to the ranked position of genes according to their differential expression in Tut4/7cKO pachytene cells. Genes are ranked from upregulated to downregulated. c Sylamer analysis of miRNA signatures for transcripts ranked according to changes in expression between Tut4/7CTL and Tut4/7cKO pachytene cells. d GAM fit of the frequency of the canonical AU-rich element AUUUA to transcripts ranked according to changes in expression between Tut4/7CTL and Tut4/7cKO pachytene cells. e GAM fit as in d where the frequency of the motif is normalized to the length of the 3′UTR. f Box plot of 5′UTR, CDS and 3′UTR length for downregulated, unchanged and upregulated transcripts in Tut4/7cKO GV oocytes. The center value represents the mean length, and the upper and middle hinges the first and third quartiles, respectively. (**P < 0.01, ****P < 0.0001, Wilcoxon test two-sided). g GAM fit of 3′UTR length to the ranked gene position according to differential expression in Tut4/7cKO GV oocytes. Genes are ranked from upregulated to downregulated. h GAM fit of the frequency of the canonical AU-rich element AUUUA to transcripts ranked according to changes in expression between Tut4/7CTL and Tut4/7cKO GV oocytes. i GAM fit as in h where the frequency of the motif is normalized to the length of the 3′UTR

Similar articles

Cited by

References

    1. Phillips BT, Gassei K, Orwig KE. Spermatogonial stem cell regulation and spermatogenesis. Philos. Trans. R. Soc. Lond. B. Biol. Sci. 2010;365:1663–1678. - PMC - PubMed
    1. Griswold MD. Spermatogenesis: the commitment to meiosis. Physiol. Rev. 2016;96:1–17. - PMC - PubMed
    1. Monesi V. Ribonucleic acid synthesis during mitosis and meiosis in the mouse testis. J. Cell Biol. 1964;22:521–532. - PMC - PubMed
    1. Paronetto MP, et al. Sam68 marks the transcriptionally active stages of spermatogenesis and modulates alternative splicing in male germ cells. Nucleic Acids Res. 2011;39:4961–4974. - PMC - PubMed
    1. Tachibana M, Nozaki M, Takeda N, Shinkai Y. Functional dynamics of H3K9 methylation during meiotic prophase progression. EMBO J. 2007;26:3346–3359. - PMC - PubMed

Publication types

Substances

LinkOut - more resources