Meta-Analysis
. 2019 Mar;51(3):404-413.
doi: 10.1038/s41588-018-0311-9. Epub 2019 Jan 7.

Genome-wide meta-analysis identifies new loci and functional pathways influencing Alzheimer's disease risk

Affiliations
Meta-Analysis

Genome-wide meta-analysis identifies new loci and functional pathways influencing Alzheimer's disease risk

Iris E Jansen et al. Nat Genet. 2019 Mar.

Erratum in

  • Author Correction: Genome-wide meta-analysis identifies new loci and functional pathways influencing Alzheimer's disease risk.
    Jansen IE, Savage JE, Watanabe K, Bryois J, Williams DM, Steinberg S, Sealock J, Karlsson IK, Hägg S, Athanasiu L, Voyle N, Proitsi P, Witoelar A, Stringer S, Aarsland D, Almdahl IS, Andersen F, Bergh S, Bettella F, Bjornsson S, Brækhus A, Bråthen G, de Leeuw C, Desikan RS, Djurovic S, Dumitrescu L, Fladby T, Hohman TJ, Jonsson PV, Kiddle SJ, Rongve A, Saltvedt I, Sando SB, Selbæk G, Shoai M, Skene NG, Snaedal J, Stordal E, Ulstein ID, Wang Y, White LR, Hardy J, Hjerling-Leffler J, Sullivan PF, van der Flier WM, Dobson R, Davis LK, Stefansson H, Stefansson K, Pedersen NL, Ripke S, Andreassen OA, Posthuma D. Jansen IE, et al. Nat Genet. 2020 Mar;52(3):354. doi: 10.1038/s41588-019-0573-x. Nat Genet. 2020. PMID: 32029921

Abstract

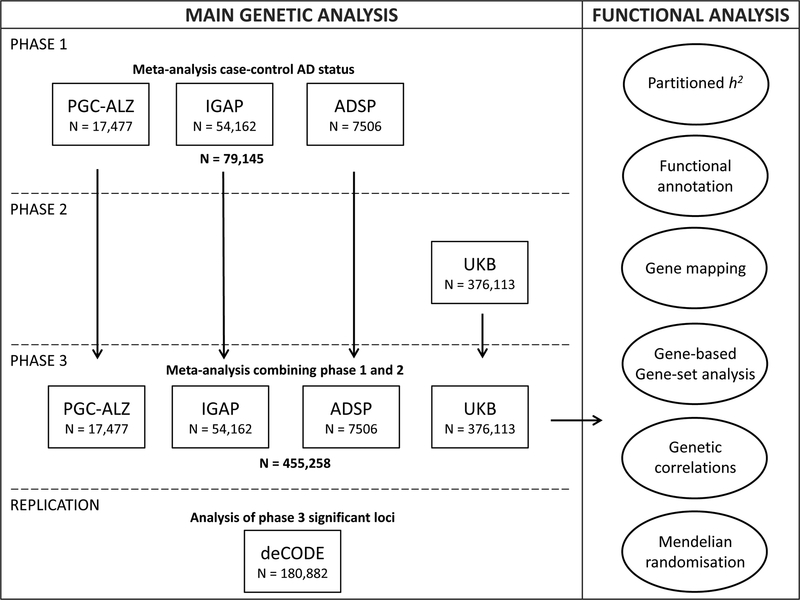
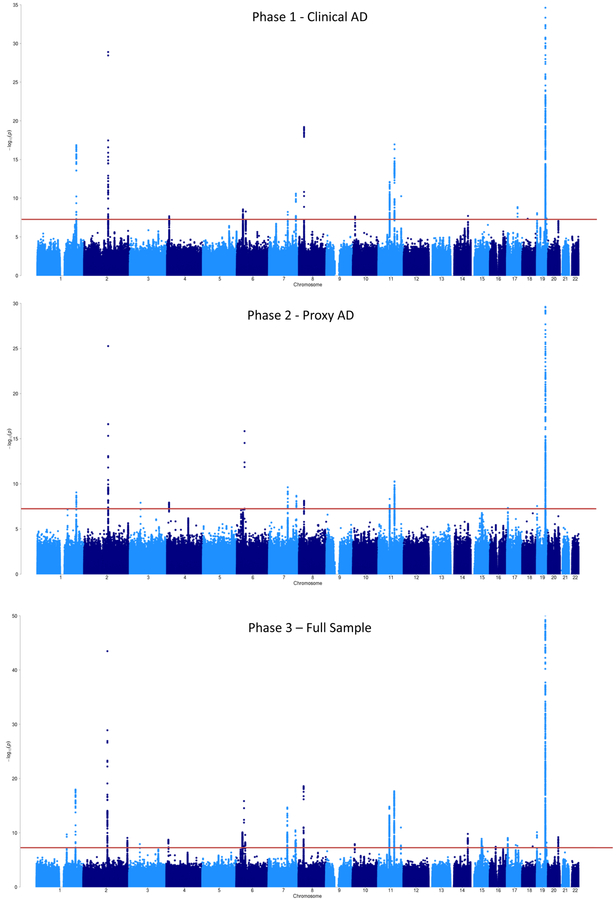
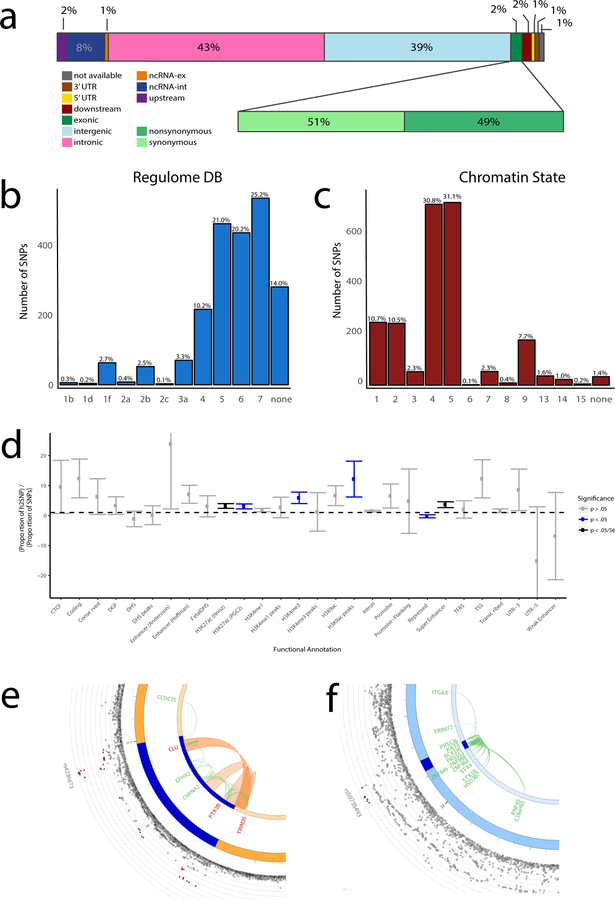
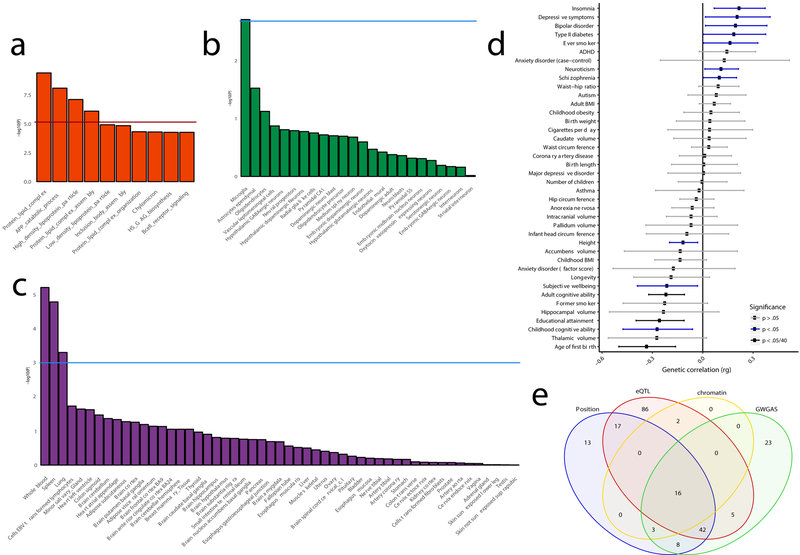
Alzheimer's disease (AD) is highly heritable and recent studies have identified over 20 disease-associated genomic loci. Yet these only explain a small proportion of the genetic variance, indicating that undiscovered loci remain. Here, we performed a large genome-wide association study of clinically diagnosed AD and AD-by-proxy (71,880 cases, 383,378 controls). AD-by-proxy, based on parental diagnoses, showed strong genetic correlation with AD (rg = 0.81). Meta-analysis identified 29 risk loci, implicating 215 potential causative genes. Associated genes are strongly expressed in immune-related tissues and cell types (spleen, liver, and microglia). Gene-set analyses indicate biological mechanisms involved in lipid-related processes and degradation of amyloid precursor proteins. We show strong genetic correlations with multiple health-related outcomes, and Mendelian randomization results suggest a protective effect of cognitive ability on AD risk. These results are a step forward in identifying the genetic factors that contribute to AD risk and add novel insights into the neurobiology of AD.


Conflict of interest statement

Competing Interests Statement

The authors report the following potentially competing financial interests. P.F.S.: Lundbeck (advisory committee), Pfizer (Scientific Advisory Board member), and Roche (grant recipient, speaker reimbursement). J.H.L.: Cartana (Scientific Advisor) and Roche (grant recipient). O.A.A.: Lundbeck (speaker’s honorarium). St.St., H.S., and K.S. are employees of deCODE Genetics/Amgen. J.H. is a cograntee of Cytox from Innovate UK (UK Department of Business). D.A. has received research support and/or honoraria from Astra-Zeneca, Lundbeck, Novartis Pharmaceuticals, and GE Health, and serves as a paid consultant for Lundbeck, Eisai, Heptares, and Axovant. All other authors declare no financial interests or potential conflicts of interest.

Figures

Figure 1.
Figure 1.. Overview of analysis steps.
The main genetic analysis encompasses the procedures to detect GWAS risk loci for AD. The functional analysis includes the in silico functional follow-up procedures with the aim to put the genetic findings in biological context. N=total of individuals within specified dataset.
Figure 2.
Figure 2.. GWAS meta-analysis for AD risk (N=455,258).
Manhattan plot displays all associations per variant ordered according to their genomic position on the x-axis and showing the strength of the association with the −log10 transformed P-values on the y-axis. The y-axis is limited to enable visualization of non-APOE loci. For the Phase 3 meta-analysis, the original −log10 P-value for the APOE locus is 276.
Figure 3.
Figure 3.. Functional annotation of GWAS results.
a) Functional effects of variants in genomic risk loci of the meta-analysis (the colours of the legend are ordered from right to left in the figure) – the second bar shows distribution for exonic variants only; b) Distribution of RegulomeDB score for variants in genomic risk loci, with a low score indicating a higher probability of having a regulatory function (see Methods); c) Distribution of minimum chromatin state across 127 tissue and cell types for variants in genomic risk loci, with lower states indicating higher accessibility (see Methods); d) Heritability enrichment of 28 functional variant annotations calculated with stratified LD score regression (bars represent standard errors). UTR=untranslated region; CTCF=CCCTC-binding factor; DHS=DNaseI Hypersensitive Site; TFBS=transcription factor binding site; DGF=DNAaseI digital genomic footprint; e) Zoomed-in circos plot of chromosome 8; f) Zoomed-in circos plot of chromosome 16. Circos plots show implicated genes by significant loci, where dark blue areas indicate genomic risk loci, green lines indicate eQTL associations and orange lines indicate chromatin interactions. Genes mapped by both eQTL and chromatin interactions are in red. The outer layer shows a Manhattan plot containing the negative log10-transformed P-value of each SNP in the GWAS meta-analysis of AD. Full circos plots of all autosomal chromosomes are provided in Supplementary Figure 4.
Figure 4.
Figure 4.. Functional implications based on gene-set analysis, genetic correlations and functional annotations.
The gene-set results are displayed per category of biological mechanisms (a), brain cell-types (b) and tissue types (c). The red horizontal line indicates the significance threshold corrected for all gene-set tests of all categories, while the blue horizontal lines display the significance threshold corrected only for the number of tests within the three categories (that is, gene-ontology, tissue expression or single cell expression); d) Genetic correlations between AD and other heritable traits (bars represent 95% confidence intervals); e) Venn diagram showing the number of genes mapped by four distinct strategies. ADHD=attention deficit hyperactivity disorder; BMI=body mass index; EBV=Epstein-Barr virus.

References

    1. Prince M, Bryce R, Albanese E, Wimo A, Ribeiro W, Ferri CP. The global prevalence of dementia: a systematic review and metaanalysis. Alzheimer’s & dementia : the journal of the Alzheimer’s Association 2013; 9(1): 63–75.e2. - PubMed
    1. Gatz M, Reynolds CA, Fratiglioni L, et al. Role of genes and environments for explaining Alzheimer disease. Arch Gen Psychiatry 2006; 63(2): 168–74. - PubMed
    1. Cacace R, Sleegers K, Van Broeckhoven C. Molecular genetics of early-onset Alzheimer’s disease revisited. Alzheimer’s & dementia : the journal of the Alzheimer’s Association 2016; 12(6): 733–48. - PubMed
    1. Lambert JC, Ibrahim-Verbaas CA, Harold D, et al. Meta-analysis of 74,046 individuals identifies 11 new susceptibility loci for Alzheimer’s disease. Nat Genet 2013; 45(12): 1452–8. - PMC - PubMed
    1. Goate A, Chartier-Harlin MC, Mullan M, et al. Segregation of a missense mutation in the amyloid precursor protein gene with familial Alzheimer’s disease. Nature 1991; 349(6311): 704–6. - PubMed

Publication types