. 2019 Feb;15(2):161-168.
doi: 10.1038/s41589-018-0193-2. Epub 2019 Jan 7.

A genetics-free method for high-throughput discovery of cryptic microbial metabolites

Affiliations

A genetics-free method for high-throughput discovery of cryptic microbial metabolites

Fei Xu et al. Nat Chem Biol. 2019 Feb.

Abstract

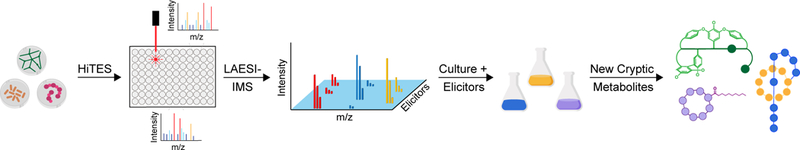
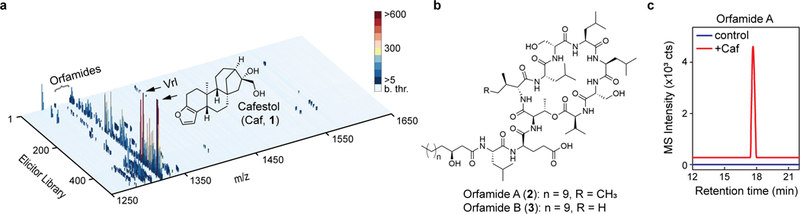
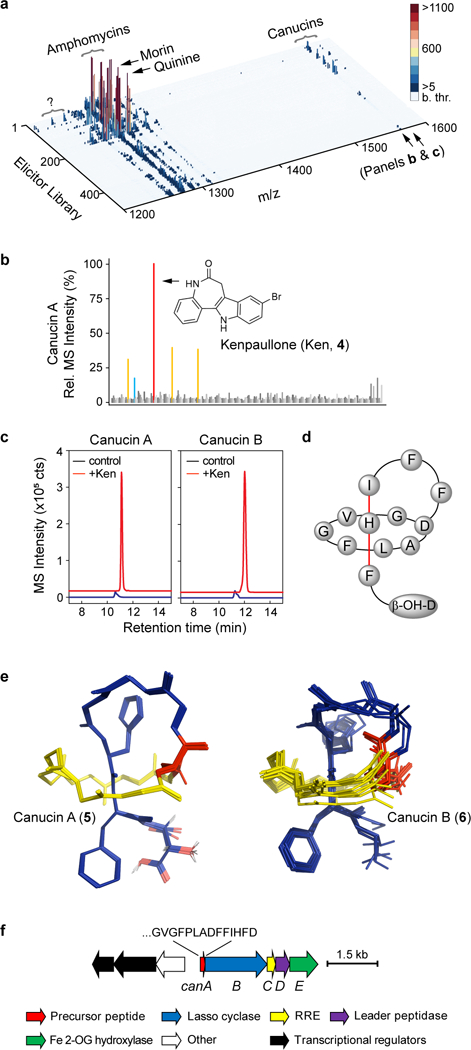
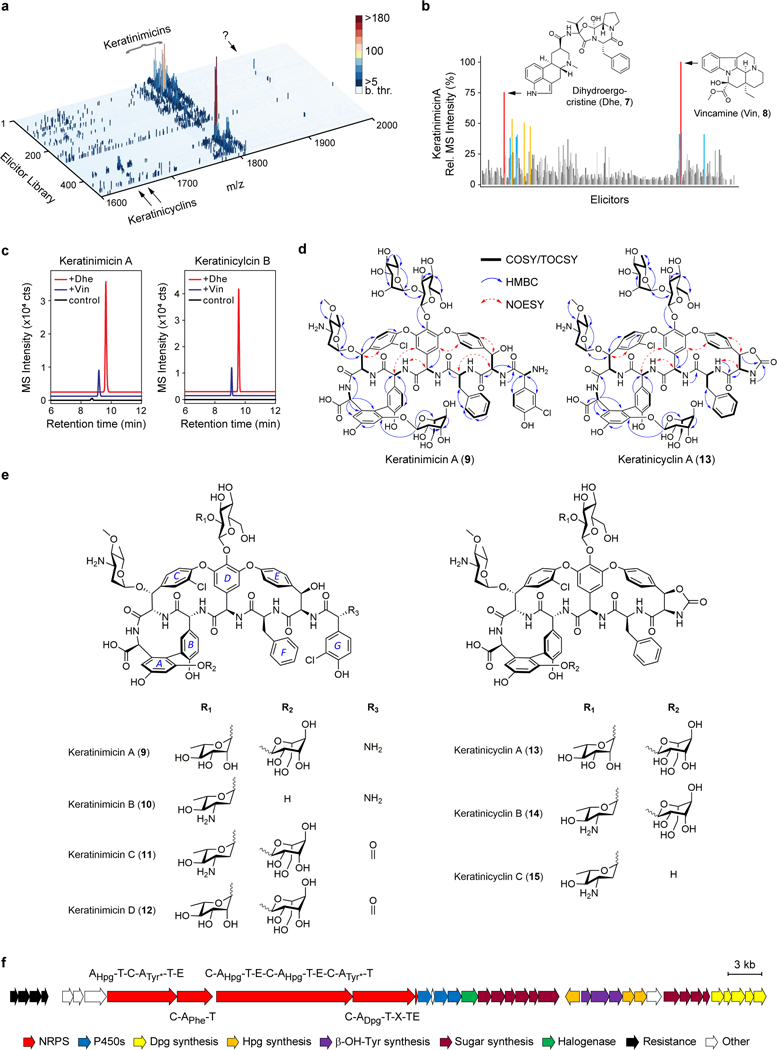
Bacteria contain an immense untapped trove of novel secondary metabolites in the form of 'silent' biosynthetic gene clusters (BGCs). These can be identified bioinformatically but are not expressed under normal laboratory growth conditions. Methods to access their products would dramatically expand the pool of bioactive compounds. We report a universal high-throughput method for activating silent BGCs in diverse microorganisms. Our approach relies on elicitor screening to induce the secondary metabolome of a given strain and imaging mass spectrometry to visualize the resulting metabolomes in response to ~500 conditions. Because it does not require challenging genetic, cloning, or culturing procedures, this method can be used with both sequenced and unsequenced bacteria. We demonstrate the power of the approach by applying it to diverse bacteria and report the discovery of nine cryptic metabolites with potentially therapeutic bioactivities, including a new glycopeptide chemotype with potent inhibitory activity against a pathogenic virus.


Figures

Fig. 1
Fig. 1. I HiTES-IMS workflow.
A bacterial culture is arrayed into 96-well plates and subjected to high-throughput elicitor screening. After a suitable incubation period, the cultures are assessed by LAESI-IMS in 96-well format. The observed global metabolome is depicted in a 3D plot that links each elicitor to metabolites, characterized by their m/z and MS intensity values. Large scale cultures with the appropriate elicitor facilitate isolation and characterization of new cryptic metabolites.
Fig. 2
Fig. 2. I Proof-of-concept application of HiTES-IMS to P. protegens.
a, 3D plot relating the P. protegens metabolome, in terms of m/z and MS intensity, to each elicitor. MS data were collected in the m/z range of 1200–2000 to focus on orfamide production, in response to a 502-member natural products library. No signals were detected below m/z 1250 or above m/z 1650. MS intensity (in counts) is color-coded according to the color bar shown; ‘b. thr.’ designates signals that were below the 5-count threshold, which were therefore not included in the plot. Orfamides are labeled, as are the best elicitors of orfamide synthesis, cafestol (Caf) and vinorelbine (Vrl). b, Structures of orfamide A and B. c, Validation of Caf as an inducer of orfamide A in flask cultures analyzed by HPLC-MS. Shown are HR-MS extracted ion chromatograms of orfamide A from untreated (blue) and Caf-treated (red) cultures. The HiTES-IMS screen was carried out in a single replicate; production of desired metabolites was validated in three independent biological replicates, with a representative result shown in panel c. All three replicates gave similar levels of induction of orfamides.
Fig. 3
Fig. 3. I Discovery of a novel, cryptic lasso peptide by HiTES-IMS.
a, Secondary metabolome of S. canus in response to 502 elicitors. MS data were collected in the m/z range of 250–1600 (see Supplementary Fig. 2). The high m/z range is shown to focus on canucins; ‘b. thr.’ on the color bar (in counts) designates below threshold of detection. Morin and quinine, which induce amphomycin synthesis, are marked. Canucins are pointed out as is an uncharacterized set of induced metabolites (question mark). b, 2D component of the 3D plot focusing on canucin A (m/z 1579). Kenpaullone (Ken) was the most effective elicitor. c, Induction of canucin A and B by Ken in flask cultures analyzed by HPLC-MS. The HR-MS extracted ion chromatogram traces are offset in the X- and Y-axes for clarity. d, Illustration of the topology of canucin A, with His12 and Phe13 providing steric locks. e, Overlay of the top-10 computed structures for canucin A and B using NMR NOESY constraints and the CYANA algorithm. Both exhibit a lasso topology. f, BGC for canucins (can) as identified by bioinformatic studies. The C-terminal sequence of CanA is shown along with predicted functions of the tailoring enzymes. The HiTES-IMS screen was carried out in a single replicate; production of desired metabolites was validated in three independent biological replicates, with representative results shown in panel c. All three replicates gave similar levels of induction of canucins.
Fig. 4
Fig. 4. I Induction of novel glycopeptides using HiTES-IMS.
a, Secondary metabolome of A. keratiniphila in response to 502 elicitors. MS data were collected in the m/z range of 250–2000 (Supplementary Fig. 4). A magnified view is shown to focus on glycopeptides; ‘b. thr.’ designates below MS detection threshold. Keratinimicins, keratinicyclins, and uncharacterized induced metabolites (question mark) are indicated. b, 2D component of the 3D plot focusing on keratinimicin A (m/z 1811). Dihydroergocristine (Dhe) and vincamine (Vin) were the most effective elicitors. c, Validation of Dhe and Vin as elicitors of keratinimicin and keratinicylin in 96-well cultures analyzed by HPLC-MS. Shown are HR-MS extracted ion chromatograms from untreated (black), Vin-treated (blue), and Dhe-treated (red) cultures. The traces are offset in the X- and Y-axes for clarity. d, Relevant NMR correlations used to solve the structures of keratinimicin A and keratinicyclin A. e, Structures of four keratinimicin and three keratinicyclin derivatives with varying substitution patterns. The nomenclature to identify different rings in glycopeptides is shown in keratinimicin A. f, The ker BGC as identified by bioinformatic analysis after sequencing the genome of A. keratiniphila. The predicted domain composition for each NRPS is shown as are the predicted functions of the remaining enzymes in the BGC. Tyr* denotes modified Tyr. The HiTES-IMS screen was carried out in a single replicate; production of desired metabolites was validated in three independent biological replicates, with representative results shown in panel c. All three replicates gave similar levels of induction of keratinimicins and keratinicyclins.

References

    1. Newman DJ & Cragg GM Natural products as sources of new drugs from 1981 to 2014. J. Nat. Prod. 79, 629–661 (2016). - PubMed
    1. Cragg GM & Newman DJ Natural products: A continuing source of novel drug leads. Biochim. Biophys. Acta. 1830, 3670–3695 (2013). - PMC - PubMed
    1. Cragg GM, Grothaus PG & Newman DJ Impact of natural products on developing new anti-cancer agents. Chem. Rev. 109, 3012–3043 (2009). - PubMed
    1. Bentley SD et al. Complete genome sequence of the model actinomycete Streptomyces coelicolor A3(2). Nature 417, 141–147 (2002). - PubMed
    1. Ikeda H et al. Complete genome sequence and comparative analysis of the industrial microorganism Streptomyces avermitilis. Nat. Biotechnol. 21, 526–531 (2003). - PubMed

ONLINE METHODS REFERENCES

    1. Hu H & Ochi K Novel Approach for Improving the Productivity of Antibiotic-Producing Strains by Inducing Combined Resistant Mutations. Appl. Environ. Microbiol. 67, 1885–1892 (2001). - PMC - PubMed
    1. Yilmaz EM & Güntert P NMR structure calculation for all small molecule ligands and non-standard residues from the PDB Chemical Component Dictionary. J. Biomol. NMR. 63, 21–37 (2015). - PubMed

Publication types

Substances