. 2019 Jan;25(1):165-175.
doi: 10.1038/s41591-018-0275-4. Epub 2019 Jan 7.

Exercise-linked FNDC5/irisin rescues synaptic plasticity and memory defects in Alzheimer's models

Affiliations

Exercise-linked FNDC5/irisin rescues synaptic plasticity and memory defects in Alzheimer's models

Mychael V Lourenco et al. Nat Med. 2019 Jan.

Abstract

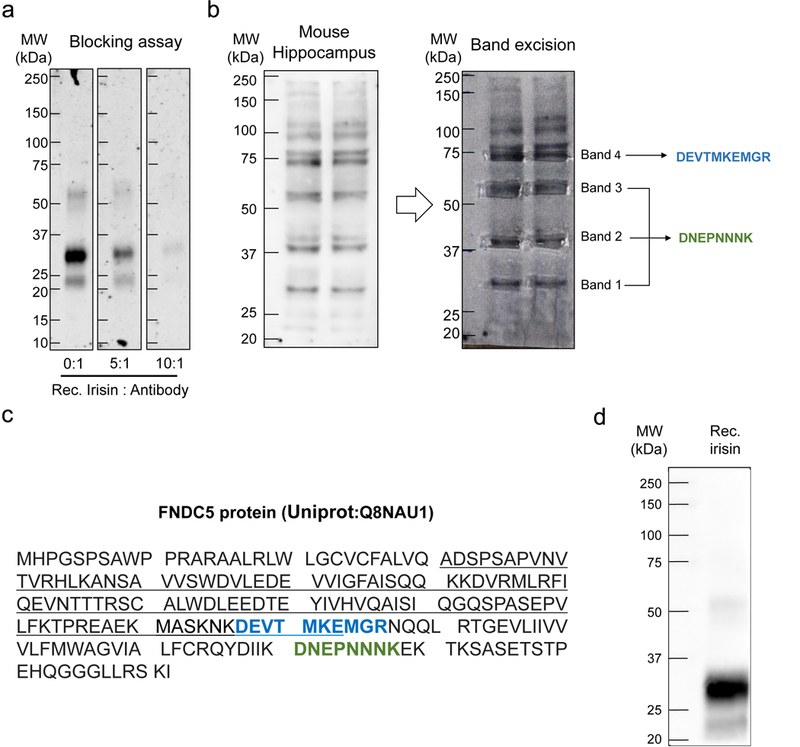
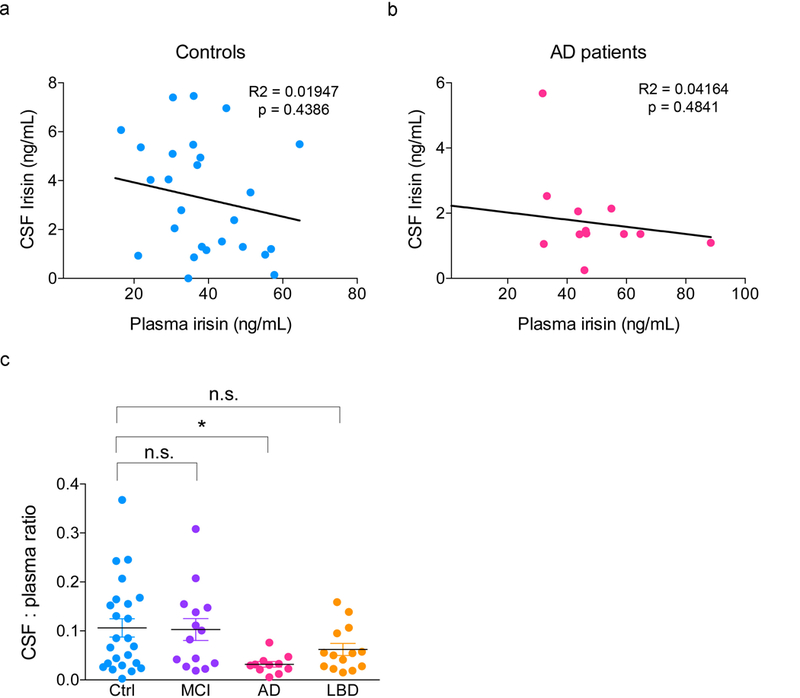
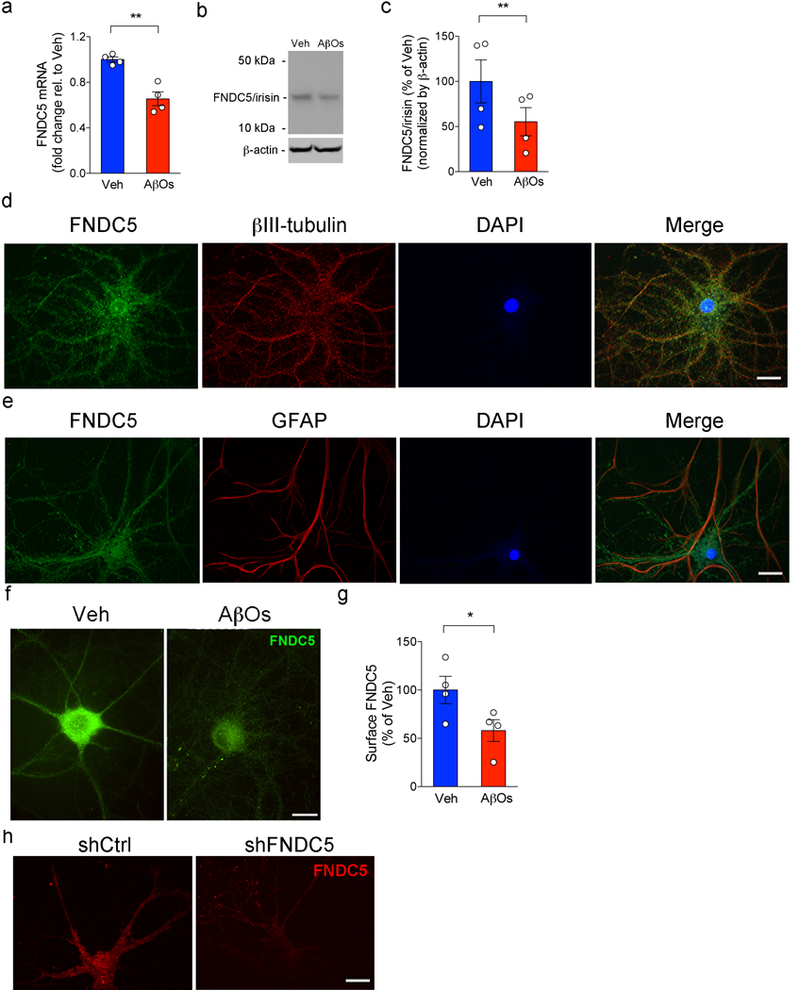
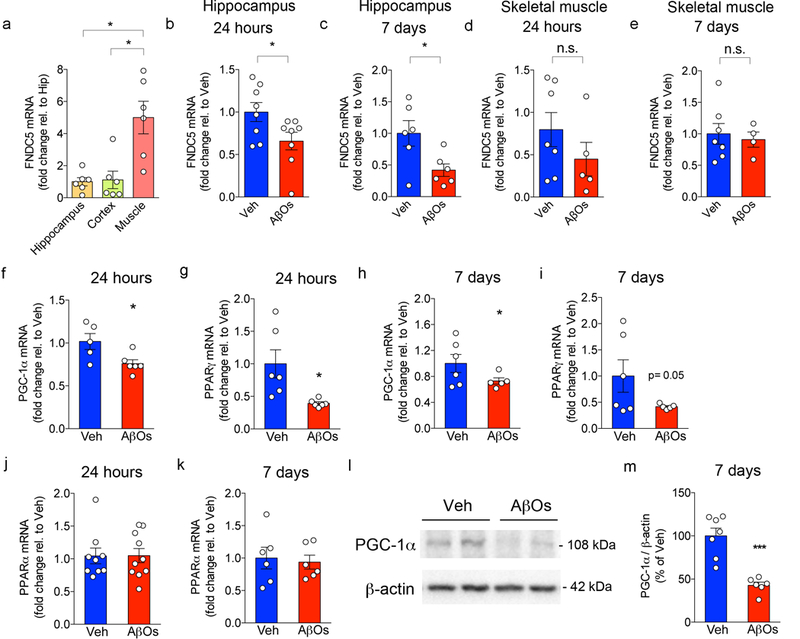
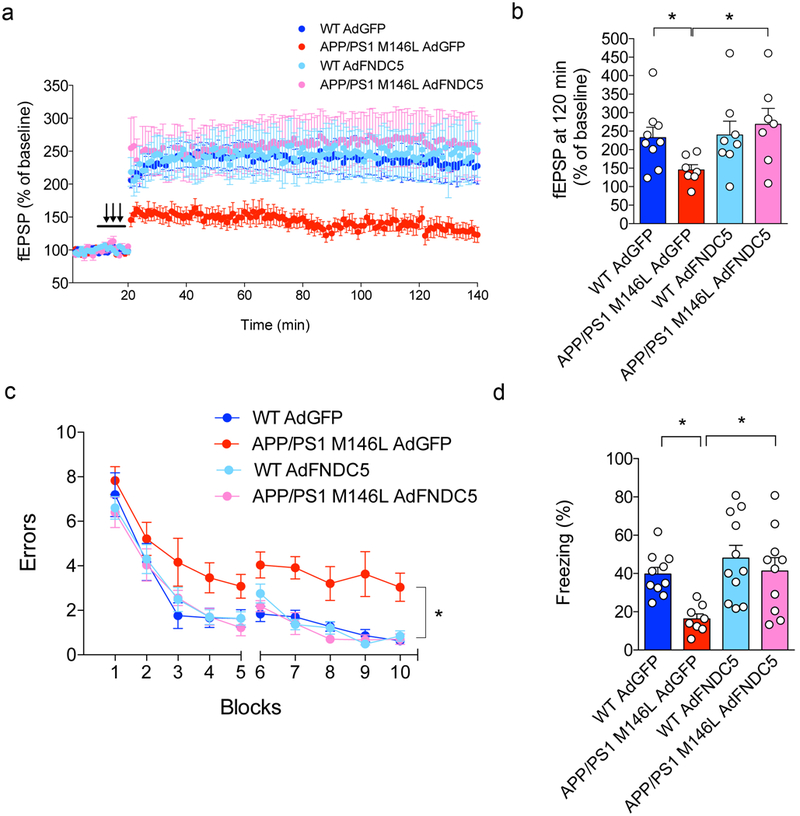
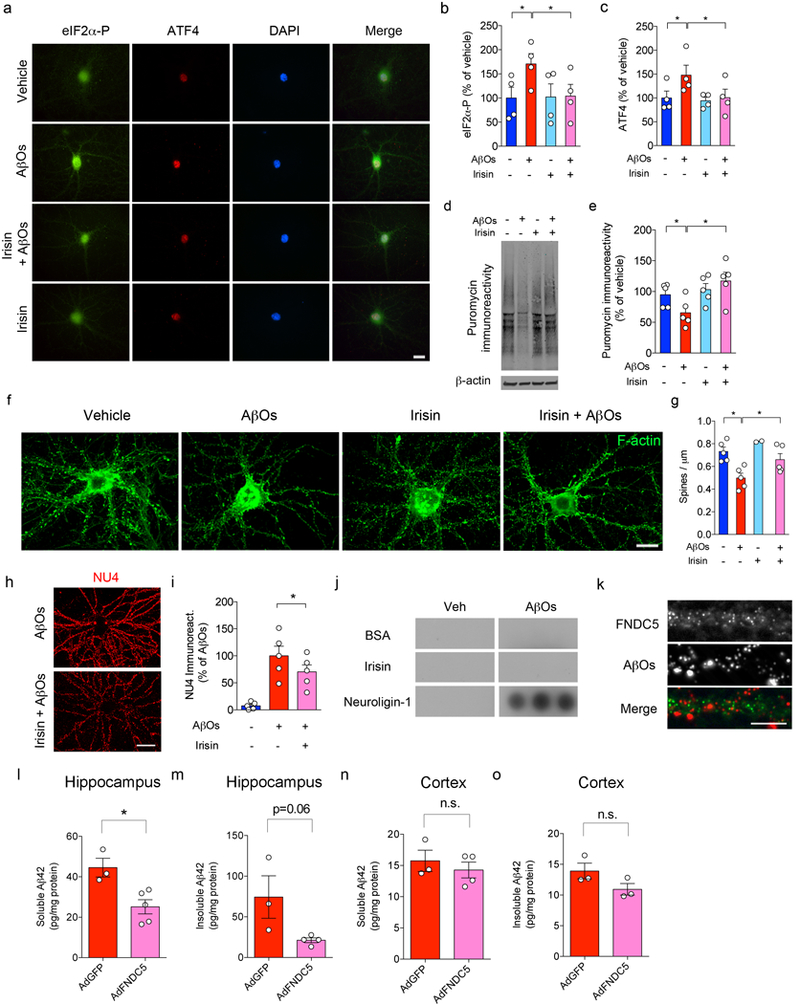
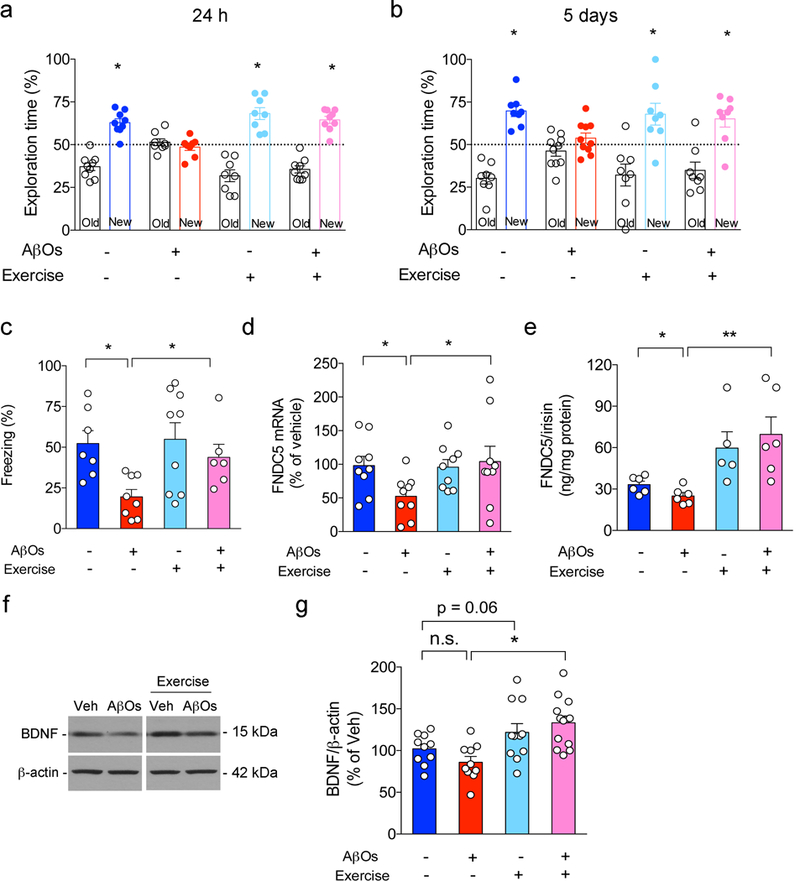
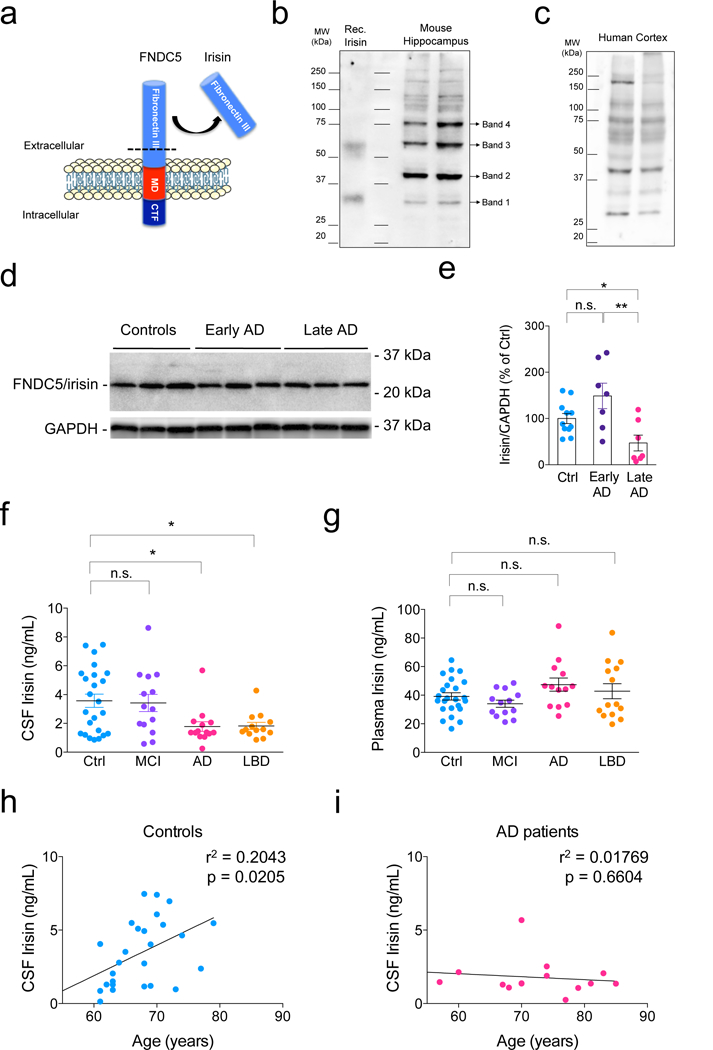
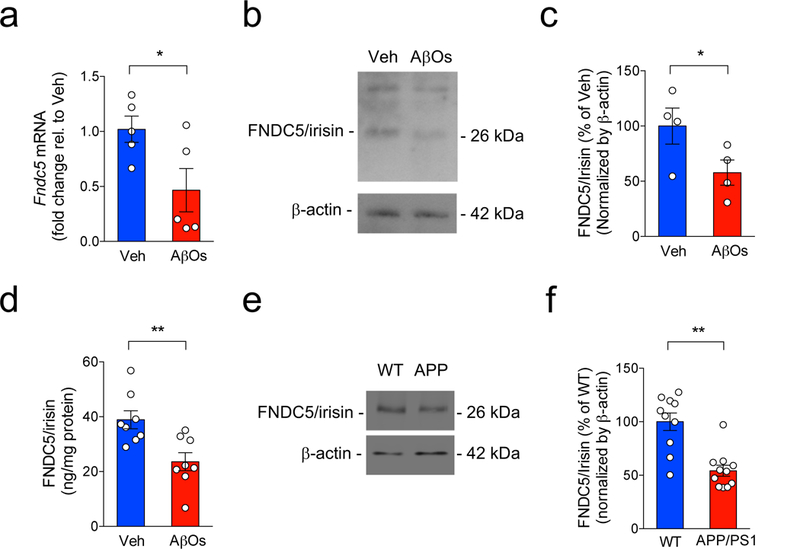
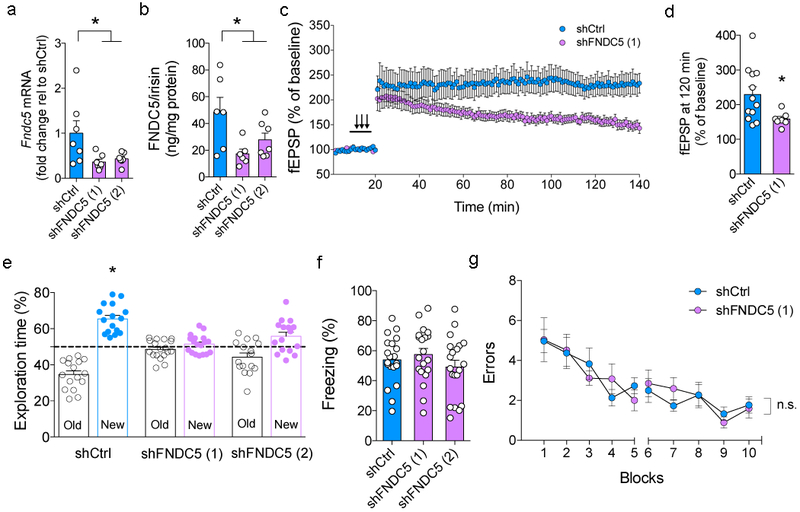
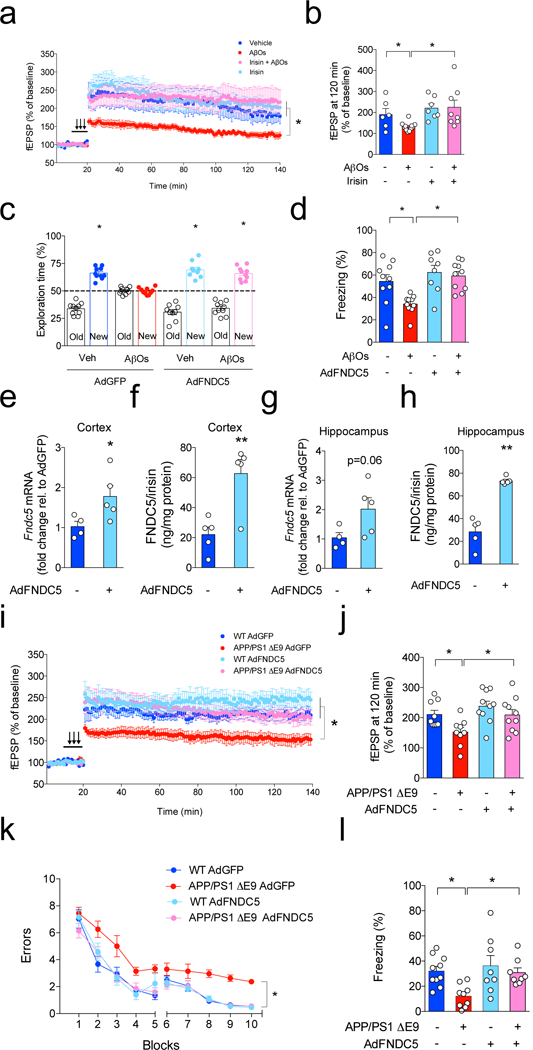
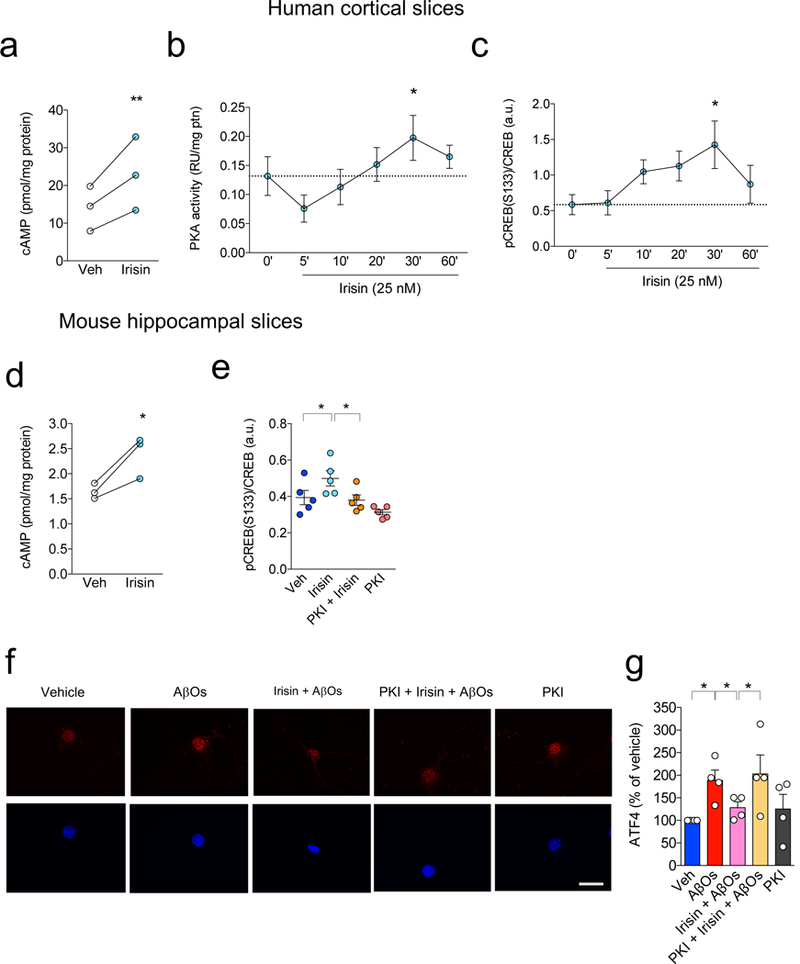
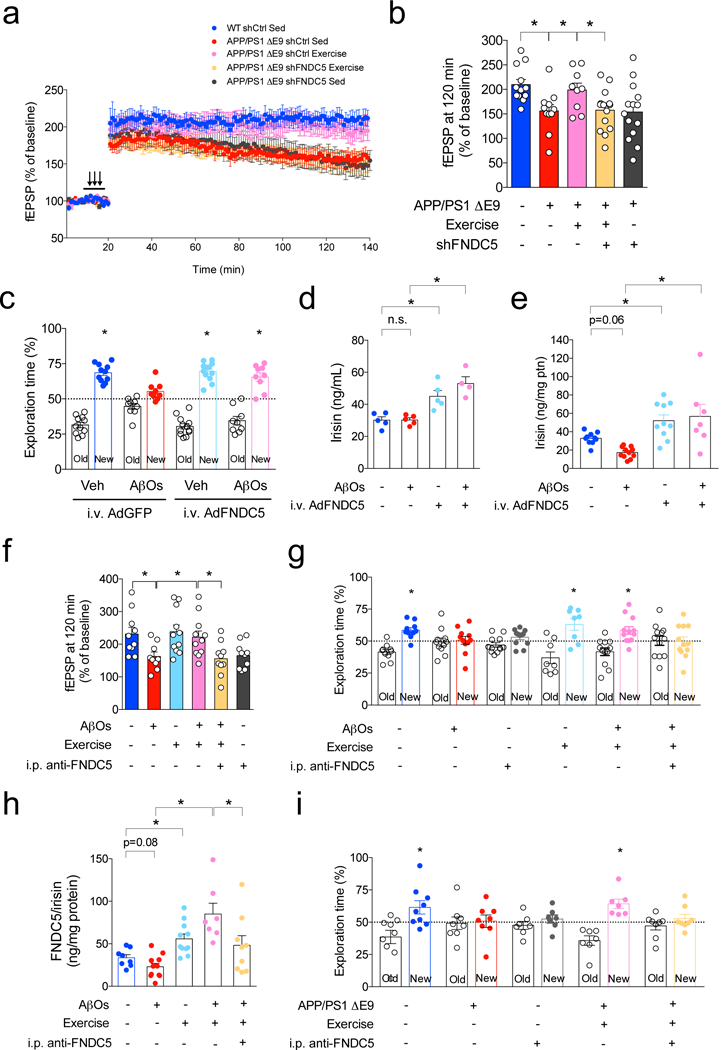
Defective brain hormonal signaling has been associated with Alzheimer's disease (AD), a disorder characterized by synapse and memory failure. Irisin is an exercise-induced myokine released on cleavage of the membrane-bound precursor protein fibronectin type III domain-containing protein 5 (FNDC5), also expressed in the hippocampus. Here we show that FNDC5/irisin levels are reduced in AD hippocampi and cerebrospinal fluid, and in experimental AD models. Knockdown of brain FNDC5/irisin impairs long-term potentiation and novel object recognition memory in mice. Conversely, boosting brain levels of FNDC5/irisin rescues synaptic plasticity and memory in AD mouse models. Peripheral overexpression of FNDC5/irisin rescues memory impairment, whereas blockade of either peripheral or brain FNDC5/irisin attenuates the neuroprotective actions of physical exercise on synaptic plasticity and memory in AD mice. By showing that FNDC5/irisin is an important mediator of the beneficial effects of exercise in AD models, our findings place FNDC5/irisin as a novel agent capable of opposing synapse failure and memory impairment in AD.


Figures

Extended Data Figure 1.
Extended Data Figure 1.. Validation of anti-FNDC5 for detection of brain FNDC5/irisin.
(a) Antibody blocking assay. Previous incubation of anti-FNDC5 (Abcam; ab131390) with increasing molar ratios of recombinant irisin (Adipogen; AG-40B-0136) reduces the signal of recombinant irisin detected by immunoblotting. The experiment was repeated 4 times with similar results. (b) Left panel: Immunoblot of mouse hippocampus homogenate probed with anti-FNDC5. Immunolabeled bands 1-4 (see “Results”) were used to guide excision of the corresponding bands from the other half of the SDS-PAGE gel that had not been electroblotted (right panel). Band excision was guided by overlaying the unstained gel onto an image of the developed immunoblot (right panel). Excised bands were subjected to in-gel tryptic digestion followed by mass spectrometry analysis, as described in Online Methods. Peptides identified by mass spectrometry in each band are indicated. (c) Full-length FNDC5 amino acid sequence. The sequence corresponding to irisin is underlined. Peptides identified by mass spectrometry in excised bands are highlighted in green (bands 1, 2 and 3) or blue (band 4). (d) Antibody used in the Phoenix ELISA kit (EK-067-29) recognizes recombinant irisin expressed in CHO cells (Adipogen; AG-40B-0136). The experiment was repeated 3 times with similar results. See Source Data 1 for original data.
Extended Data Figure 2.
Extended Data Figure 2.. CSF and plasma irisin correlations.
(a,b) CSF:plasma irisin levels correlation in controls (N = 26) (a) or AD patients (b) (N = 14; lines represent linear regression fits to the data; r and p values as indicated in the figure). (c) CSF to plasma irisin ratio is selectively reduced in AD patients, as compared to controls, MCI or LBD patients (N = 26 controls, 14 MCI, 11 AD, 13 LBD cases). Data are shown as mean ± SEM, *p<0.05; One-way ANOVA with Holm-Sidak post-test.
Extended Data Figure 3.
Extended Data Figure 3.. AβOs reduce FNDC5/irisin levels in hippocampal neurons.
(a-c) Primary cultured hippocampal neurons were exposed to 500 nM AβOs for 24 h. Fndc5 mRNA (a) and FNDC5/irisin protein levels (b,c) in cultured hippocampal neurons exposed or not to AβOs (N = 4 experiments with independent neuronal cultures and AβO preparations; Date are shown as mean ± SEM,**p<0.01; paired Student’s t-test; two-sided). See Source Data 5 for original data. (d,e) Colocalization of surface FNDC5 immunoreactivity (green) with β-tubulin III (red) immunoreactivity in cultured hippocampal neurons (d). Colocalization of surface FNDC5 immunoreactivity (green) with glial fibrillary acidic protein (GFAP) (red) (e). The experiment was repeated 2 times with similar results in independent cultures. (f,g) Primary cultured hippocampal neurons were exposed to 500 nM AβOs for 24 h. (g) Summary quantification of surface FNDC5 immunoreactivity in cultured neurons (N = 4 experiments with independent neuronal cultures and AβO preparations; 30 images (from 2-3 coverlips) per condition per experiment. Data are shown as mean ± SEM *p<0.05, paired Student’s t-test; two-sided). (h) Surface FNDC5 immunoreactivity (red) in 18 DIV cultured hippocampal neurons after lentiviral knockdown of FNDC5 (shFNDC5) (N = 2 experiments with independent cultures; 30 images (from 2-3 coverslips) per condition per experiment). Scale bar = 10 mm.
Extended Data Figure 4.
Extended Data Figure 4.. AβOs reduce hippocampal FNDC5, PGC-1α and PPARγ expression.
(a) Hippocampal, cortical and skeletal muscle (gastrocnemius) expression of FNDC5 in C57BL/6 mice (N = 6 per group). Data are shown as mean ± SEM; *p<0.05; paired one-way ANOVA with Holm-Sidak correction; two-sided. (b,c) Hippocampal FNDC5 mRNA in C57BL/6 i.c.v-infused with 10 pmol AβOs for 24 hours (N = 8 per group) (b) or 7 days (N = 5 per group) (c). Data are shown as mean ± SEM; *p<0.05; Student’s t-test; two-sided). (d,e) Skeletal muscle (gastrocnemius) FNDC5 mRNA in C57BL/6 i.c.v-infused with 10 pmol AβOs for 24 h (N = 7 Veh, 5 AβOs) (d) or 7 days (N = 7 Veh, 4 AβOs) (e). Data are shown as mean ± SEM; *p<0.05; Student’s t-test; two-sided). (f-k) Hippocampal mRNA levels of PGC-1α (f,h), PPARγ (g,i) and PPARα (j,k) were measured 24 h or 7 days after infusion, as indicated (N = 5 per group). mRNA levels were normalized by β-actin expression. (l,m) AβOs reduced hippocampal PGC-1α protein levels in C57BL/6 mice 7 days after infusion (N = 7 Veh, 6 AβOs). Data are shown as mean ± SEM; *p<0.05; Student’s t-test; two-sided). See Source Data 6 for original data.
Extended Data Figure 5.
Extended Data Figure 5.. Lentiviral vectors expressing shFNDC5 did not cause motor impairment or affect body weight gain in mice.
(a) Distance traveled and (b) mean velocity of mice allowed to explore an open field arena for 5 min (N = 9 mice for shCtrl, 10 mice each for shFNDC5 (1) and (2) groups). Data are shown as mean ± SEM. (c) Body weight measured 0, 14 or 28 days after lentiviral injections (N = 10 mice per group; one-way ANOVA followed by Holm-Sidak post-test). Data are shown as mean ± SEM. No significantly statistical difference was found among groups.
Extended Data Figure 6.
Extended Data Figure 6.. Intrahippocampal administration of recombinant irisin prevents AβO-induced memory impairment.
(a,b) Male Swiss mice (3 months old) were bilaterally injected with recombinant irisin (75 pmol per hippocampus) and received 10 pmol AβOs i.c.v. Novel object recognition (a) and contextual fear conditioning (b) tasks (tested 5 days post infusion of AβOs) (N = 9 mice for Veh, 10 for AβOs, 9 for irisin and 7 for AβOs + irisin). Data are shown as mean ± SEM. *p<0.05, Two-way ANOVA with Holm-Sidak post-test; two-sided.
Extended Data Figure 7.
Extended Data Figure 7.. Validation of PCR array results by qPCR.
(a-f) AdFNDC5 expression of 6 synapse plasticity-related genes after AβO injection: (a) Egr1, (b) Egr4, (c) Gria2, (d) Grm2, (e) Nptx2, and (f) Ppp3ca. N = 6 mice per experimental group. Data are shown as mean ± SEM. *p<0.05; two-way ANOVA with Holm-Sidak post-test; two-sided.
Extended Data Figure 8.
Extended Data Figure 8.. FNDC5/irisin rescues defective synaptic plasticity and memory in APP/PS1 M146L mice.
(a-d) APP/PS1 M146L mice (or WT littermates) were injected i.c.v. with an adenoviral vector expressing full-length FNDC5 (AdFNDC5) or green fluorescent protein (AdGFP, used as a control). Hippocampal slices were obtained and subjected to high-frequency stimulation for LTP recordings. (a) Field excitatory postsynaptic potentials (fEPSP) in hippocampal slices from each experimental group (N = 9 slices for Veh AdGFP, 7 for APP/PS1 M146L AdGFP, 8 for WT AdFNDC5, 7 for APP/PS1 M146L AdFNDC5; from 3-4 animals per group). (b) fEPSP at 120 min. (c,d) I.c.v.-injected AdFNDC5 rescued memory impairment in 3-4 months-old APP/PS1 M146L mice in 2-day radial arm water maze (c) and in contextual fear conditioning (d) (N = 10 mice for WT GFP, 8 for APP/PS1 GFP, 11 for WT FNDC5, 10 for APP/PS1 FNDC5). Data are shown as mean ± SEM. *p<0.05; two-way ANOVA with Holm-Sidak post-test; two-sided.
Extended Data Figure 9.
Extended Data Figure 9.. Irisin counteracts AD-linked activation of cellular stress response and dendritic spine loss in hippocampal neurons.
(a) Effect of irisin on AβO-induced increases in eIF2α-P (green) and upregulation of nuclear ATF4 (red). Nuclei were counterstained in blue (DAPI). Scale bar = 5 mm. (b,c) Summary quantification of immunocytochemistry experiments (N = 4 experiments with independent neuronal cultures and AβO preparations). *p<0.05; two-way ANOVA with Holm-Sidak correction; two-sided. Data are represented by mean ± SEM. (d,e) Summary quantification of of protein synthesis in hippocampal neurons, as measured by non-radioactive puromycin incorporation (SUnSET) normalized by β-actin levels (N = 4 experiments with independent hippocampal cultures and AβO preparations). *p<0.05; two-way ANOVA with Holm-Sidak correction; two-sided. Data are represented by mean ± SEM. (f,g) Representative images of dendritic spines in hippocampal neurons, as measured by F-actin labeling with Alexa-conjugated phalloidin (N = 5 experiments with independent neuronal cultures and AβO preparations). Scale bar = 20 mm. *p<0.05, two-way ANOVA. Data are shown as mean ± SEM. At least 30 neurons were analyzed per condition per experiment in immunocytochemistry experiments. (h,i) AβO binding to cultured hippocampal neurons, as detected by AβO-sensitive antibody NU4 (red), after treatment with recombinant irisin (25 nM). Scale bar = 10 mm. The experiments were repeated 5 times with similar results. (i) Summary quantification of 5 experiments with independent neuronal cultures and AβO preparations. Data are shown as mean ± SEM. *p<0.05; paired one-way ANOVA; two-sided. (j) AβO interaction with different proteins in a plate-binding assay. BSA was used as a negative control, while neuroligin-1 was used as a positive control (N = 3 experiments with independent AβO preparations). Representative dots were cropped from the same film. See Source Data 7 for original data. (k) Double immunocytochemistry co-localization between AβOs (red) and surface FNDC5 (green) in primary cultured hippocampal neurons (3 experiments with independent neuronal cultures and AβO preparations, with 20-25 images (from 2-3 coverslips) per experiment). Scale bar = 5 mm. The experiments were repeated 3 times with similar results. (l-o) Levels of soluble (l,n) and insoluble Aβ42 (m,o) in and hippocampus (N = 3 for AdGFP, 5 for AdFNDC5) and cortex (N = 3 for AdGFP, 4 for AdFNDC5) of APP/PS1 M146L mice. (m,o) Levels of insoluble Aβ42 in the hippocampus (N = 3 for AdGFP, 4 for AdFNDC5) (l) and cortex (N = 3 per group) (o) of APP/PS1 M146L mice. Data are shown as mean ± SEM. *p<0.05; Student’s t-test; two-sided.
Extended Data Figure 10.
Extended Data Figure 10.. Exercise blocks AβO-induced memory impairment in mice.
Effect of exercise (swimming; 5 weeks, 5 days/week, 1 h/day) on memory impairment induced by i.c.v. infusion of AβOs in Swiss mice. (a-c) Novel object recognition assessed 24 hours (N = 9 mice for vehicle, 8 for AβOs, 8 for exercise, 9 for exercise+AβOs) (a) or 5 days post infusion of AβOs (N = 8 mice for vehicle, 10 for AβOs, 8 for exercise and 8 for exercise+AβOs) (b). Data are shown as mean ± SEM. *p<0.05; one-sample Student’s t-test; (c) Contextual fear conditioning assessed 7 days post infusion of AβOs (N = 7 mice for vehicle, 8 for AβOs, 9 for exercised and 6 for exercised+AβOs). *p>0.05; two-way ANOVA followed by Holm-Sidak post-test; two-sided). (d,e) Hippocampal FNDC5 mRNA (d) (N = 9 mice per group) and FNDC5/irisin protein levels (e; measured by ELISA) after 5 weeks of exercise (N = 6 mice each for vehicle, AβOs and exercise+AβOs, and 5 for exercise) in male Swiss mice that received 10 pmol AβOs i.c.v. (f,g) Hippocampal BDNF levels in exercised mice (N = 10 mice for vehicle and AβOs, 11 for exercise, 13 for exercise+AβOs). Data are shown as mean ± SEM. *p<0.05; **p<0.01, two-way ANOVA followed by Holm-Sidak post-test; two-sided. Representative bands were cropped from the same membrane. See Source Data 8 for original data.
Figure 1.
Figure 1.. CNS FNDC5/irisin is reduced in AD.
(a) Schematic representation of FNDC5 containing irisin, as part of the fibronectin III domain, which is cleaved by proteolysis and released to the extracellular medium. (b,c) Representative immunoblots of anti-FNDC5 (Abcam ab131390) in the mouse hippocampus (b) and human cortex (c). Bands analyzed by mass spectrometry (see Extended Data Figure 1 and Source Data 1) are indicated. These Western blots were repeated 3 times with similar results. (d,e) Summary quantification of human hippocampal irisin protein levels in late stage AD or early AD cases as compared to healthy controls (N = 11 controls, 7 early AD, 7 late AD). *p<0.05; **p<0.01, two-sided one-way ANOVA with Holm-Sidak post-test. Values are expressed as mean ± SEM. The experiments were repeated 2 times with similar results. See Source Data 2 for original data. (f) Summary quantification of irisin in the cerebrospinal fluid (CSF) of AD and Lewy body dementia (LBD) patients compared to healthy controls or mild cognitive impairment (MCI) patients. (N = 26 controls, 14 MCI, 14 AD, 13 LBD patients). *p<0.05, two-sided one-way ANOVA followed by Holm-Sidak post-test. Centre values are expressed as mean ± SEM. (g) Plasma levels of irisin in AD and LBD patients compared to healthy controls or MCI patients (N = 26 controls, 13 MCI, 13 AD, 14 LBD patients). (h, i) Correlation between age and CSF irisin in control (N = 31) and AD patients (N = 14; linear regression; r2 and p values as indicated).
Figure 2.
Figure 2.. Brain FNDC5/irisin is reduced in AD models.
Fndc5 mRNA (a) and irisin levels (b,c) in control (Veh) and AβO-exposed human adult cortical slices after 12 h of treatment (N = 5 independent tissue donors for mRNA; 4 donors for protein levels; *p<0.05, paired Student’s t-test; two-sided). Irisin levels were normalized by β-actin. The experiments were repeated 3 times with similar results. See Source Data 3 for original data. (d) ELISA quantification of hippocampal irisin levels in WT C57BL/6 mice 24 h post-AβO infusion (N = 8 mice per group, **p<0.01, paired Student’s t-test; two-sided). The experiments were repeated 2 times with similar results. (e,f) Hippocampal levels of irisin in 13-16 month-old APP/PS1 ΔE9 mice (N = 10 for WT and 11 for APP/PS1 ΔE9, **p<0.01, paired Student’s t-test; two-sided). The experiments were repeated 2 times with similar results. See Source Data 4 for original data. Bars express mean ± SEM.
Figure 3.
Figure 3.. Downregulation of brain FNDC5/irisin impairs synaptic plasticity and object recognition memory in mice.
Two distinct shRNAs targeting Fndc5 (shFNDC5 1 or 2) or shCtrl were i.c.v. injected in C57BL/6 mice. Levels of Fndc5 mRNA (a) and FNDC5/irisin protein (b) in control (shCtrl) compared to shFNDC5 (1)- or shFNDC5 (2)-injected mice (N = 7 mice per group; *p<0.05, one-way ANOVA with Holm-Sidak correction) in the frontal cortex. Bars express mean ± SEM. (c) Average traces for field excitatory postsynaptic potentials (fEPSPs) in hippocampal slices from each experimental group (N =12 slices for shCtrl, 7 slices for shFNDC5 (1) obtained from 3-4 mice per group). Traces represent mean ± SEM per time. (d) fEPSP at 120 min. (N =12 slices for shCtrl, 7 slices for shFNDC5 obtained from 3-4 mice per group; *p<0.05, repeated measures two-way ANOVA with Holm-Sidak correction; two-sided). (e) Summary quantification of novel object discrimination in the NOR task in shCtrl, shFNDC5 (1)- or shFNDC5 -injected mice. *p<0.05, statistically different from 50% (chance level) (N = 16 mice for shCtrl; 18 for shFNDC5 (1), 16 for the shFNDC5 (2) group; one-sample t-test). (f) Contextual fear conditioning in shCtrl or shFNDC5-infused C57BL/6 mice (N = 20 mice per group; no significant difference was observed. One-way ANOVA followed by Holm-Sidak correction; two-sided). Bars express mean ± SEM. (g) shCtrl or shFNDC5(1)-infused C57BL/6 mice were assessed in a two-day radial arm water maze (RAWM) task and presented similar error profile across trials. Each block consisted of three consecutive trials. N = 9 shCtrl, 11 shFNDC5 (1); repeated measures two-way ANOVA. Values are presented as mean ± SEM.
Figure 4.
Figure 4.. Brain FNDC5/irisin rescues defective synaptic plasticity and memory in AD mice.
(a,b) LTP measurement in hippocampal slices (N = 6 slices for vehicle, 11 for AβOs, 7 for irisin, 8 for irisin + AβOs; slices were from 4 animals for each condition). (b) fEPSP at 120 min. (N = 6 slices for vehicle, 11 for AβOs, 7 for irisin, 8 for irisin + AβOs; *p<0.05, two-way ANOVA with Holm-Sidak correction; two-sided). Values are presented as mean ± SEM. (c,d) Effect of i.c.v injection of AdFNDC5 on memory impairment in AβO-infused C57BL/6 mice in the novel object recognition (c) and contextual fear conditioning (d) tasks (N = 10 mice for Veh GFP, 10 for AβOs GFP, 8 for Veh FNDC5, 10 for AβOs FNDC5; *p<0.05, statistically different from 50% (chance level) one-sample t-test). Bars are presented as mean ± SEM. (e,f) Cortical Fndc5 mRNA and protein expression in C57BL/6 mice 6 days after i.c.v. injection of AdGFP or AdFNDC5 vectors (N = 4 mice for AdGFP, 5 for AdFNDC5; Student’s t-test; *p<0.05). (g,h) Hippocampal Fndc5 mRNA and protein expression in C57BL/6 mice 6 days after i.c.v. injection of AdGFP or AdFNDC5 vectors (N = 4 mice for AdGFP, 5 for AdFNDC5; *p<0.05; Student’s t-test; two-sided. Bars are presented as mean ± SEM. (i-j) APP/PS1 ΔE9 mice (or WT littermates) were injected i.c.v. with an adenoviral vector expressing full-length FNDC5 (AdFNDC5) or green fluorescent protein (AdGFP, used as a control). (i) Average traces for field excitatory postsynaptic potentials (fEPSPs) in hippocampal slices from each experimental group (n = 10 slices for WT AdGFP, 9 APP/PS1 ΔE9 AdGFP, 10 WT AdGFP, 10 APP/PS1 ΔE9 AdFNDC5; from 4 animals per group). Traces represent mean ± SEM. (j) fEPSP at 120 min (n = 10 slices for WT AdGFP, 9 APP/PS1 ΔE9 AdGFP, 10 WT AdGFP, 10 APP/PS1 ΔE9 AdFNDC5; from 4 animals per group; *p<0.05, one-way ANOVA with Holm-Sidak correction; two-sided). (k,l) Effects of i.c.v. injection of AdFNDC5 on memory impairment in 3-4 month-old APP/PS1 ΔE9 mice in a two-day radial arm water maze (i) and in contextual fear conditioning (j) (N = 10 mice for WT AdGFP, 8 for APP/PS1 ΔE9 AdGFP, 11 for WT AdFNDC5, 10 for APP/PS1 ΔE9 AdFNDC5). (*p<0.05, Two-way ANOVA with Holm-Sidak correction; two-sided). Data are represented by mean ± SEM.
Figure 5.
Figure 5.. Irisin triggers brain cAMP/PKA/CREB signaling pathways.
(a-d) Summary quantification of the effect of irisin (25 nM) on cyclic AMP (cAMP) accumulation (a), PKA activation (b) and CREB phosphorylation (c) in human cortical slices (N = 3 independent experiments with slices from different tissue donors for cAMP and pCREB, and 4 for PKA assay; *p<0.05; **p<0.01; repeated-measures ANOVA; two-sided). Data are represented by mean ± SEM. (d) Analysis of cyclic AMP (cAMP) accumulation induced by irisin (25 nM) in mouse hippocampal slices (N = 4 independent experiments with 6-8 slices from 4 independent animals; *p<0.05; paired Student’s t-test; two-sided), and (e) CREB activation (N = 2 independent experiments with 5 slices from 3 animals; *p<0.05; two-way ANOVA with Holm-Sidak correction; two-sided). Data are represented by mean ± SEM, n defined per slice. (f) Nuclear ATF4 levels (red) in primary cultures exposed to AβOs and/or irisin in the presence of PKI 14-22, a PKA selective inhibitor. Nuclei were counterstained in blue (DAPI). Scale bar = 10 μm. (g) Summary quantification of immunocytochemistry experiments (N = 4 experiments with independent neuronal cultures and AβO preparations; 30 images (from 2-3 coverslips) per experimental condition per experiment). *p<0.05; paired two-way ANOVA with Holm-Sidak correction, two-sided. Data are represented by mean ± SEM.
Figure 6.
Figure 6.. FNDC5/irisin mediates the beneficial effects of exercise on synaptic plasticity and memory.
(a-b) APP/PS1 ΔE9 mice (or WT littermates) were injected i.c.v. with a lentiviral vector expressing an shRNA targeting FNDC5 (shFNDC5) or an shRNA targeting luciferase (shCtrl, used as a control), and were exercised. (a) Average traces for field excitatory postsynaptic potentials (fEPSPs) in hippocampal slices from each experimental group (N = 12 slices for WT shCtrl Sedentary (Sed), 11 for APP/PS1 ΔE9 shCtrl Sed, 9 for APP/PS1 ΔE9 shCtrl Exercised, 14 for APP/PS1 ΔE9 shFNDC5 Exercised, 12 for APP/PS1 ΔE9 shFNDC5 Sed; from 4 animals per group). Traces are represented by mean ± SEM. (b) fEPSP at 120 min. *p<0.05, Two-way ANOVA with Holm-Sidak correction. (N = 12 slices for WT shCtrl Sedentary (Sed), 11 for APP/PS1 ΔE9 shCtrl Sed, 9 for APP/PS1 ΔE9 shCtrl Exercised, 14 for APP/PS1 ΔE9 shFNDC5 Exercised, 12 for APP/PS1 ΔE9 shFNDC5 Sed; from 4 animals per group; *p<0.05, one-way ANOVA with Holm-Sidak correction; two-sided). Values are represented by mean ± SEM. (c) Effect of intravenously (i.v.) administered AdFNDC5 on NOR memory in AβO-infused mice 24 h after oligomer infusion (N = 11 Veh AdGFP; 9 AβOs AdGFP; 12 Veh AdFNDC5; 9 AβOs AdFNDC5; *p<0.05, statistically different from 50% (chance level) one-sample t-test). Values are represented by mean ± SEM. (d,e) Effect of i.v.AdFNDC5 administration on plasma (N = 5 mice for Veh AdGFP, 5 AβOs AdGFP, 5 Veh AdFNDC5, 4 AβOs AdFNDC5) (d) and hippocampal FNDC5/irisin levels (10 Veh AdGFP, 11 AβOs AdGFP, 10 Veh AdFNDC5, 7 AβOs AdFNDC5; *p<0.05, two-way ANOVA with Holm Sidak correction; two-sided). Values are represented by mean ± SEM. (e) in Veh- or AβO-injected C57BL/6 mice (10 Veh AdGFP, 11 AβOs AdGFP, 10 Veh AdFNDC5, 7 AβOs AdFNDC5; *p<0.05, two-way ANOVA with Holm Sidak correction; two-sided). Values are represented by mean ± SEM. (f,g) AD mice were intraperitoneally injected with an anti-FNDC5 antibody and exercised. They were tested on synaptic plasticity and NOR memory 72 h after AβO infusion. (f) Summary quantification of fEPSP at 120 min (N = 10 slices for Veh, 9 for AβOs, 11 for Exercise, 11 for Exercise + AβOs, 10 for anti-FNDC5, 10 for anti-FNDC5 + Exercise + AβOs; from 4 animals per group; *p<0.05, one-way ANOVA with Holm-Sidak correction; two-sided). Values are represented by mean ± SEM. (g) NOR performed 72 h after AβO infusion (N = 10 mice for Veh, 11 for AβOs, 12 for i.p. anti-FNDC5, 8 for Exercise, 12 for Exercise + AβOs, and 12 for i.p. anti-FNDC5 + Exercise + AβOs); *p<0.05; one-sample t-test. Values are represented by mean ± SEM. (h) Analysis of i.p. injections of anti-FNDC5 on exercise-induced hippocampal FNDC5/irisin in AβO-infused mice (N = 8 mice for Veh, 11 for AβOs, 11 for Exercise, 7 for Exercise + AβOs, and 9 for i.p. anti-FNDC5 + Exercise + AβOs). *p<0.05; one-way ANOVA with Holm-Sidak correction; two-sided. Values are represented by mean ± SEM. (i) APP/PS1 ΔE9 mice (or WT littermates) were injected i.p. with anti-FNDC5 (or an irrelevant IgG), and subjected to exercise. NOR memory was assessed 8 days after the first antibody injection and daily exercise session. Effect of anti-FNDC5 on the beneficial actions of exercise in APP/PS1 ΔE9 mice (N = 9 mice for WT, 8 APP/PS1 ΔE9, 7 WT i.p. anti-FNDC5, 8 Exercise APP/PS1 ΔE9, 7 APP/PS1 ΔE9 Exercise injected i.p. with anti-FNDC5). *p<0.05; one-sample t-test. Values are represented by mean ± SEM.

Comment in

References

    1. Prince M, et al. The global prevalence of dementia: a systematic review and meta-analysis. Alzheimer’s & Dementia 9, 63–75 e62 (2013). - PubMed
    1. Ferreira ST, Lourenco MV, Oliveira MM & De Felice FG Soluble amyloid-β oligomers as synaptotoxins leading to cognitive impairment in Alzheimer’s disease. Frontiers in Cellular Neuroscience 9, 191 (2015). - PMC - PubMed
    1. Fernandez AM & Torres-Alemán I The many faces of insulin-like peptide signalling in the brain. Nature Reviews Neuroscience 13, 225–239 (2012). - PubMed
    1. Biessels GJ & Reagan LP Hippocampal insulin resistance and cognitive dysfunction. Nature Reviews Neuroscience 16, 660–671 (2015). - PubMed
    1. McEwen BS Preserving neuroplasticity: Role of glucocorticoids and neurotrophins via phosphorylation. Proceedings of the National Academy of Sciences 112, 15544–15545 (2015). - PMC - PubMed

Publication types

MeSH terms