

Identifying perfusion deficits on CT perfusion images using temporal similarity perfusion (TSP) mapping
- PMID: 30617478
- PMCID: PMC7295083
- DOI: 10.1007/s00330-018-5896-y
Identifying perfusion deficits on CT perfusion images using temporal similarity perfusion (TSP) mapping
Abstract
Objectives: Deconvolution-derived maps of CT perfusion (CTP) data may be confounded by transit delays. We propose temporal similarity perfusion (TSP) analysis to decrease CTP maps' dependence on transit times and investigate its sensitivity to detect perfusion deficits.
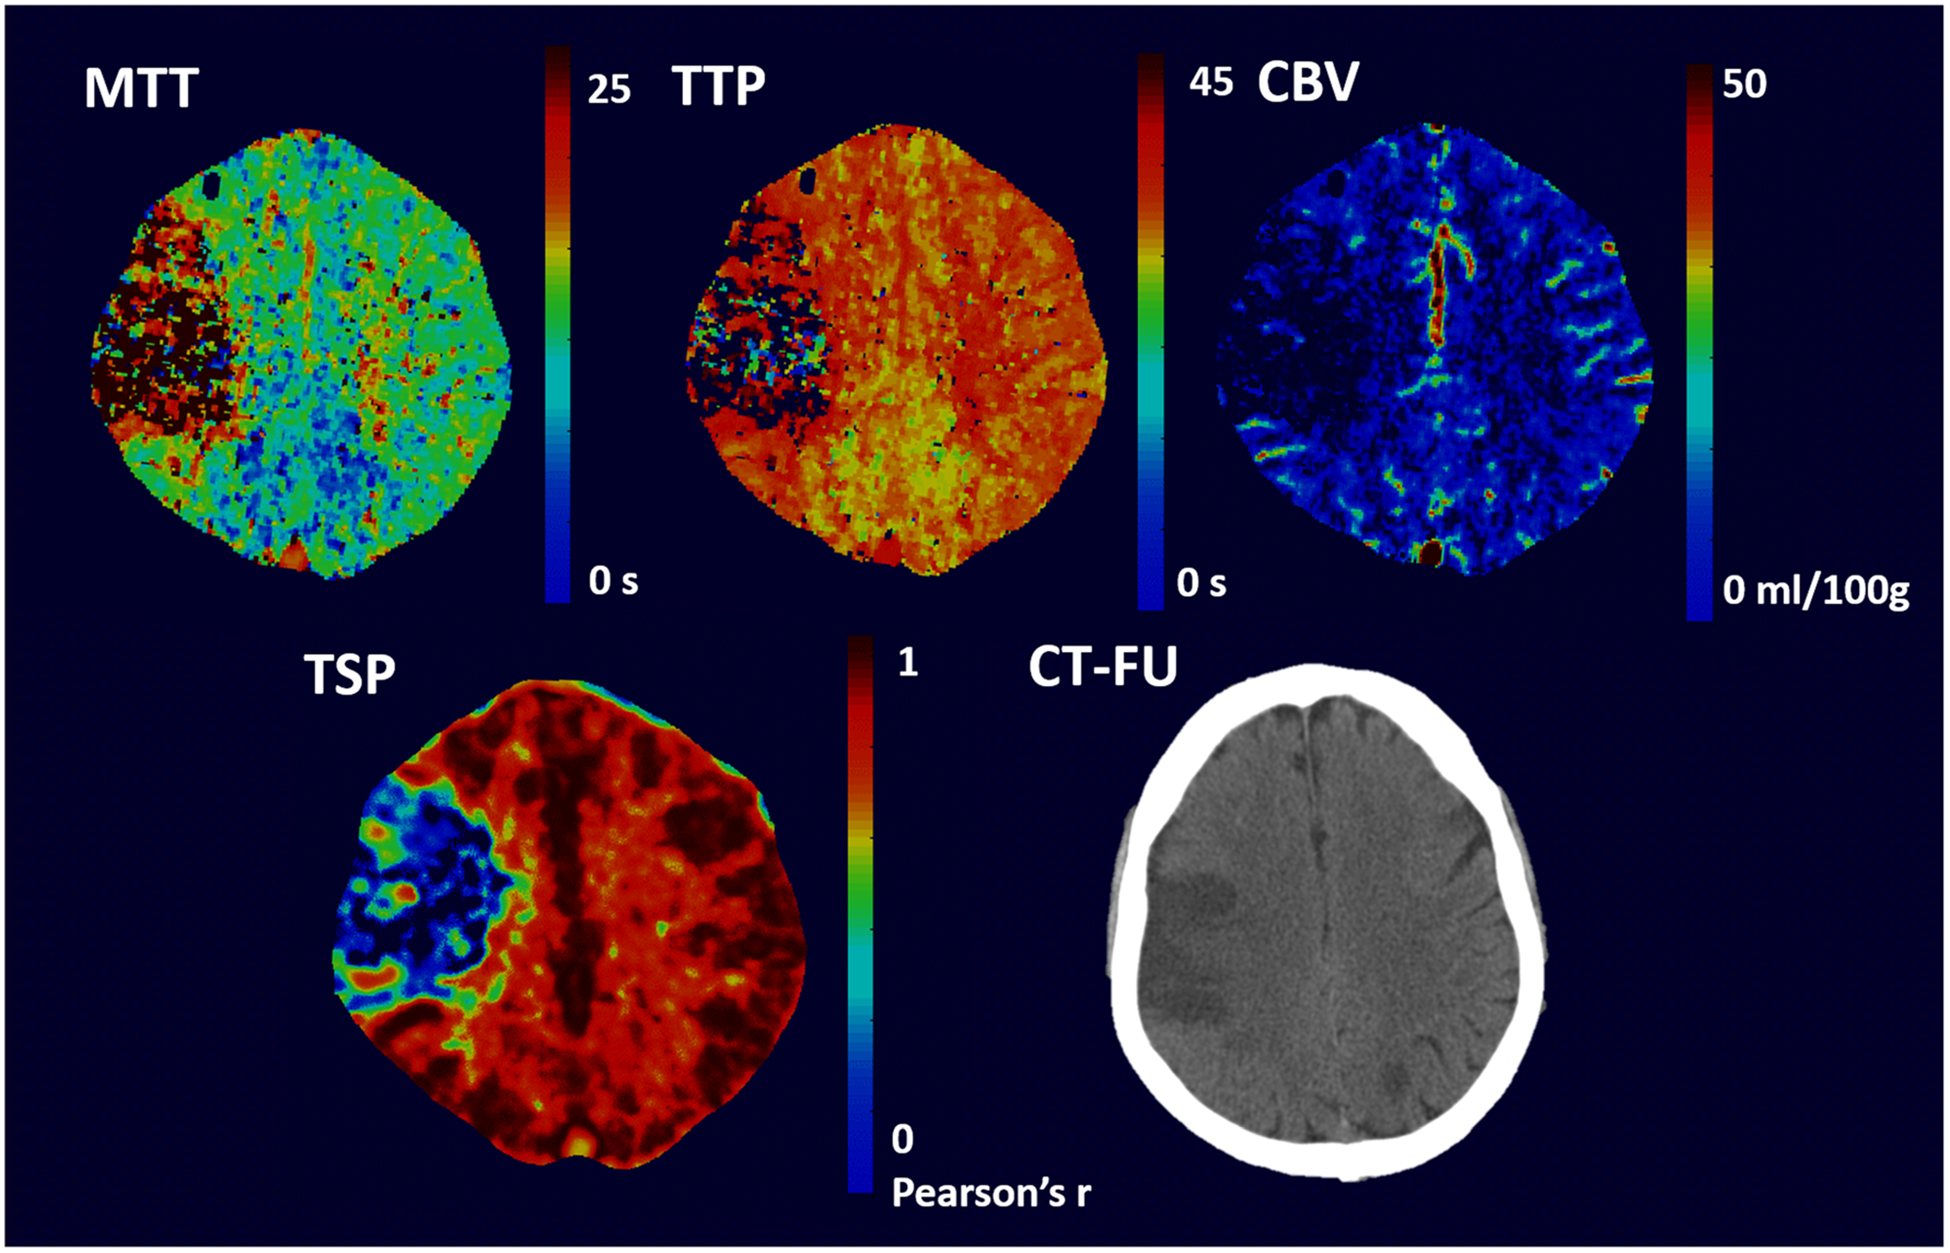
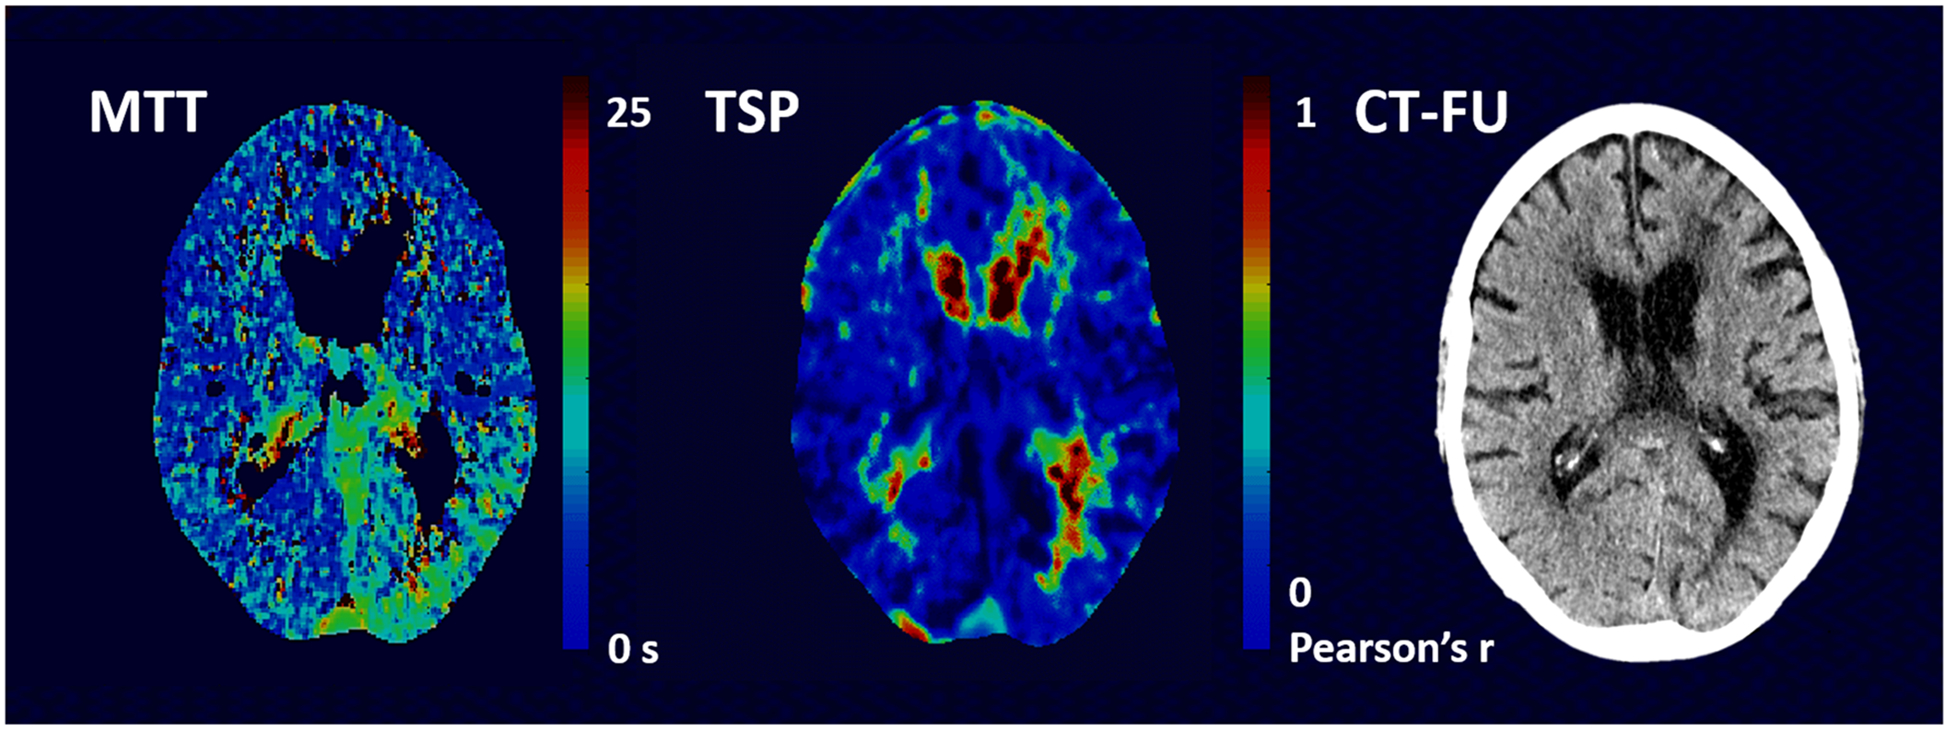
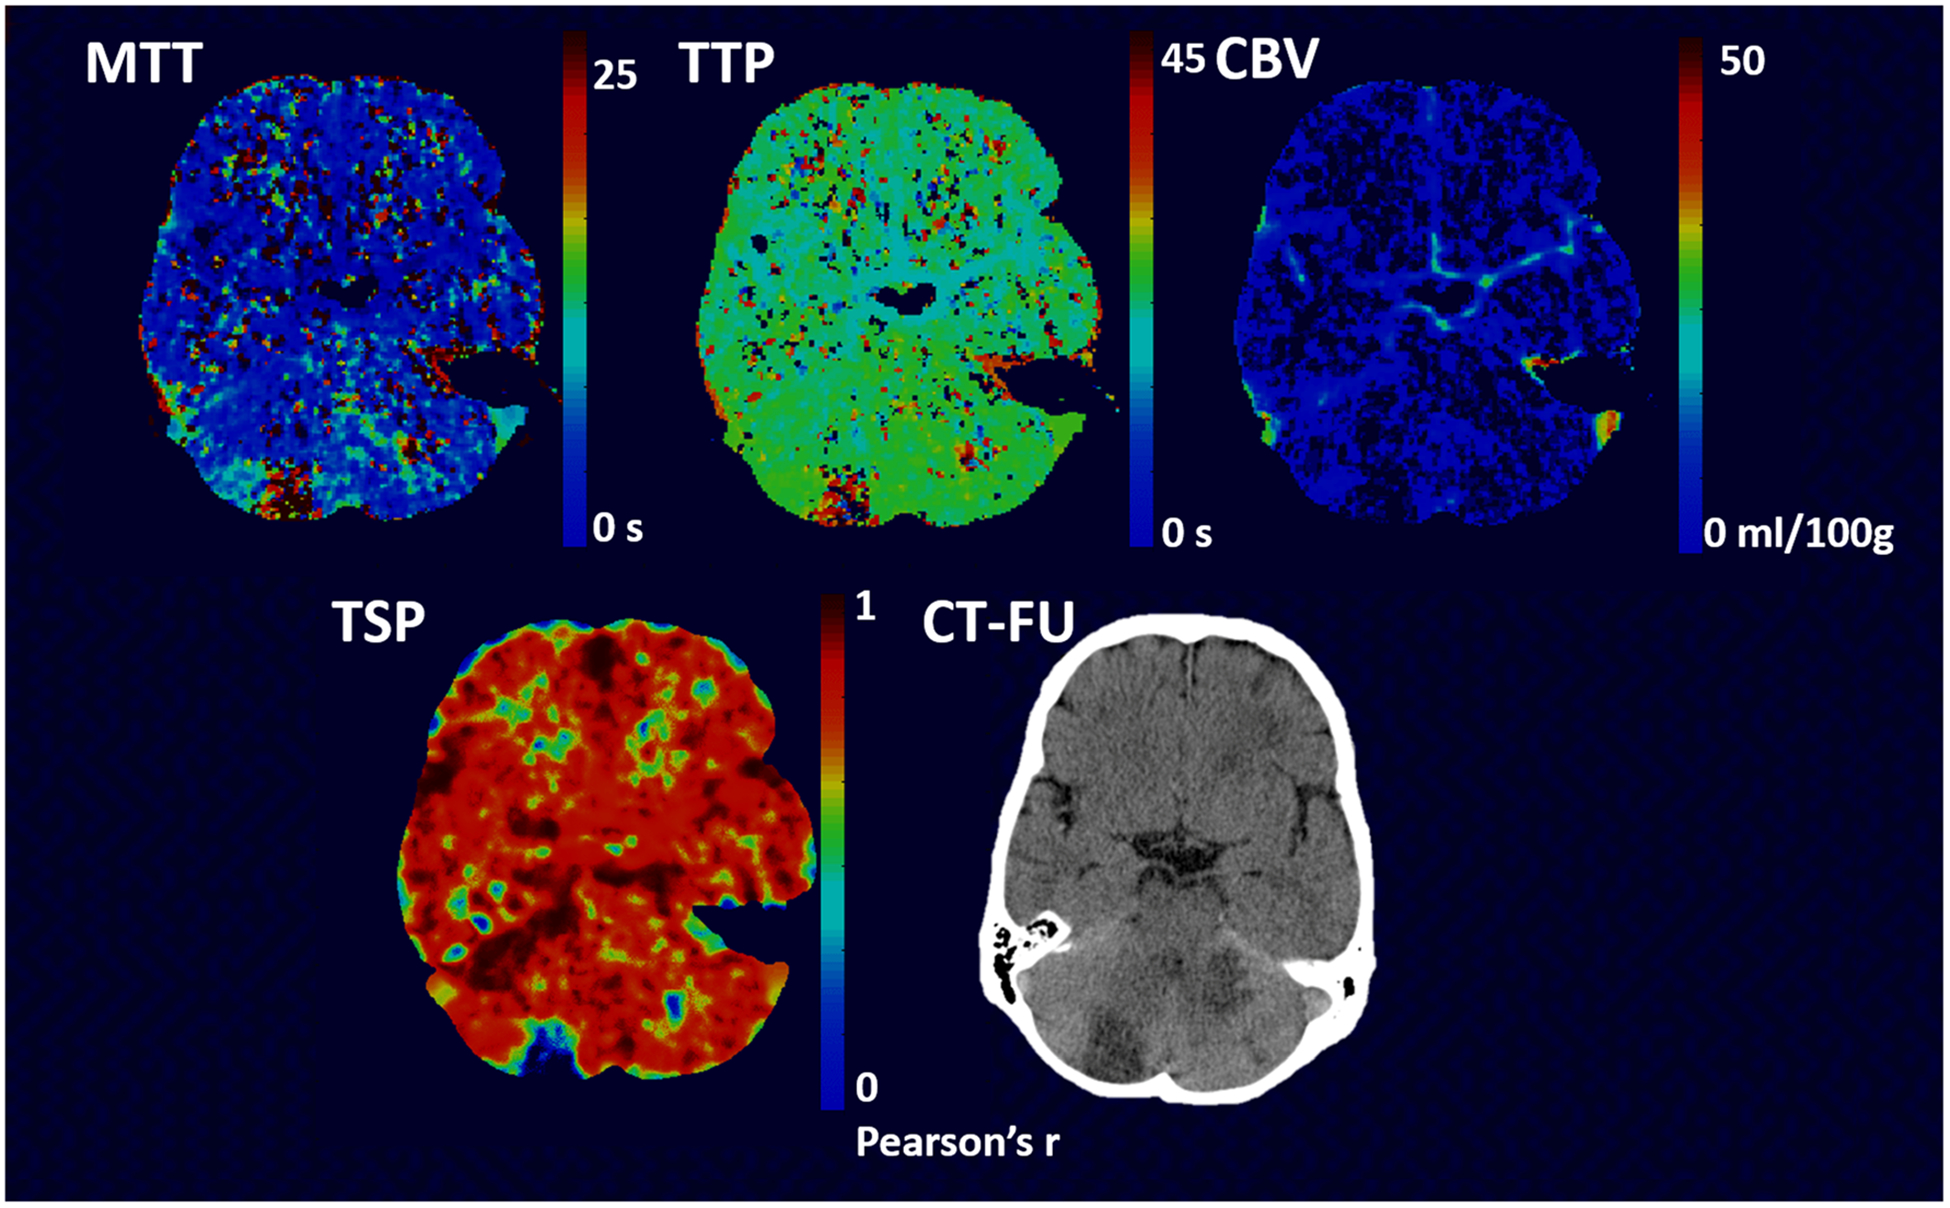
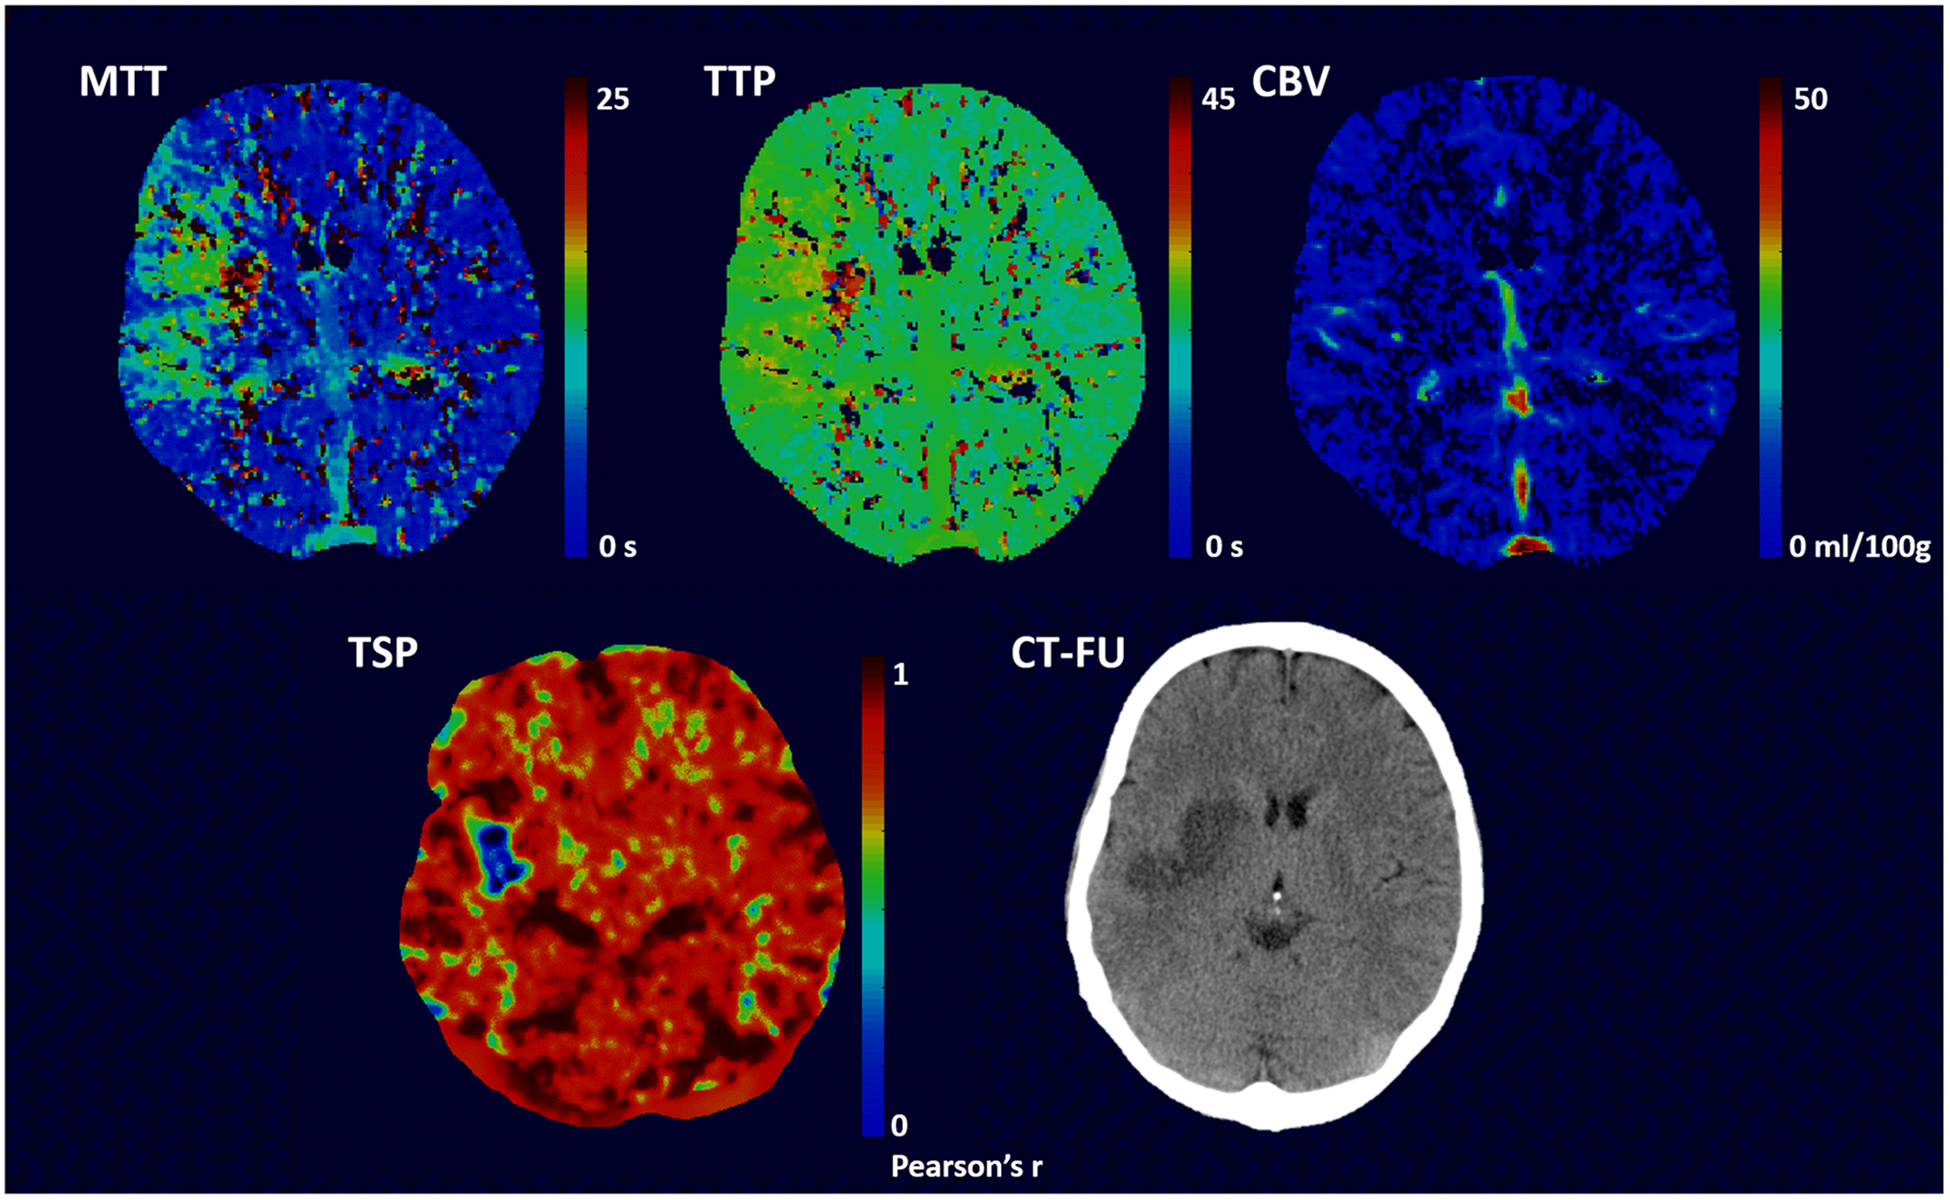
Methods: CTP data of acute stroke patients obtained within 9 h of symptom onset was analyzed using a delay-insensitive singular value decomposition method and with TSP. The TSP method applies an iterative process whereby a pixel's highest Pearson's R value is obtained through comparison of a pixel's time-shifted signal density time-series curve and the average whole brain signal density time-series curve. Our evaluation included a qualitative and quantitative rating of deconvolution maps (MTT, CBV, and TTP), of TSP maps, and of follow-up CT.
Results: Sixty-five patients (mean 68 (SD 13) years, 34 male) were included. A perfusion deficit was identified in 90%, 86%, 65%, and 84% of MTT, TTP, CBV, and TSP maps. The agreement of MTT, TTP, and TSP with CT follow-up was comparable but noticeably lower for CBV. CBV had the best relationship with final infarct volume (R2 = 0.77, p < 0.001), followed by TSP (R2 = 0.63, p < 0.001). Intra-rater agreement of an inexperienced reader was higher for TSP than for CBV/MTT maps (kappa's of 0.79-0.84 and 0.63-0.7). Inter-rater agreement for experienced readers was comparable across maps.
Conclusions: TSP maps are easier to interpret for inexperienced readers. Perfusion deficits detected by TSP are smaller which may suggest less dependence on transit delays although more investigation is required.
Key points: • Temporal similarity perfusion mapping assesses CTP data based on similarities in signal time-curves. • TSP maps are comparable in perfusion deficit detection to deconvolution maps. • TSP maps are easier to interpret for inexperienced readers.
Keywords: Brain ischemia; Humans; Perfusion; Stroke; Tomography, X-ray computed.
Conflict of interest statement
Figures
Similar articles
-
Whole-brain CT perfusion: reliability and reproducibility of volumetric perfusion deficit assessment in patients with acute ischemic stroke.Neuroradiology. 2013 Jul;55(7):827-35. doi: 10.1007/s00234-013-1179-0. Epub 2013 Apr 9. Neuroradiology. 2013. PMID: 23568701
-
Cerebral blood flow is the optimal CT perfusion parameter for assessing infarct core.Stroke. 2011 Dec;42(12):3435-40. doi: 10.1161/STROKEAHA.111.618355. Epub 2011 Oct 6. Stroke. 2011. PMID: 21980202
-
Temporal similarity perfusion mapping: A standardized and model-free method for detecting perfusion deficits in stroke.PLoS One. 2017 Oct 3;12(10):e0185552. doi: 10.1371/journal.pone.0185552. eCollection 2017. PLoS One. 2017. PMID: 28973000 Free PMC article.
-
In Acute Stroke, Can CT Perfusion-Derived Cerebral Blood Volume Maps Substitute for Diffusion-Weighted Imaging in Identifying the Ischemic Core?PLoS One. 2015 Jul 20;10(7):e0133566. doi: 10.1371/journal.pone.0133566. eCollection 2015. PLoS One. 2015. PMID: 26193486 Free PMC article.
-
Reliability of CT perfusion in the evaluation of the ischaemic penumbra.Neuroradiol J. 2014 Feb;27(1):91-5. doi: 10.15274/NRJ-2014-10010. Epub 2014 Feb 24. Neuroradiol J. 2014. PMID: 24571838 Free PMC article.
References
-
- Nogueira RG, Jadhav AP, Haussen DC et al. (2018) Thrombectomy 6 to 24 hours after stroke with a mismatch between deficit and infarct. N Engl J Med 378:11–21 - PubMed
-
- Sanelli PC, Lev MH, Eastwood JD, Gonzalez RG, Lee TY (2004) The effect of varying user-selected input parameters on quantitative values in CT perfusion maps. Acad Radiol 11:1085–1092 - PubMed
-
- Kudo K, Sasaki M, Ogasawara K, Terae S, Ehara S, Shirato H (2009) Difference in tracer delay-induced effect among deconvolution algorithms in CT perfusion analysis: quantitative evaluation with digital phantoms. Radiology 251:241–249 - PubMed
Publication types
MeSH terms
Grants and funding
LinkOut - more resources
Full Text Sources
Medical
Miscellaneous
