. 2018 Dec 14:12:913.
doi: 10.3389/fnins.2018.00913. eCollection 2018.

A Metric for Evaluating Neural Input Representation in Supervised Learning Networks

Affiliations

A Metric for Evaluating Neural Input Representation in Supervised Learning Networks

Richard R Carrillo et al. Front Neurosci. .

Abstract

Supervised learning has long been attributed to several feed-forward neural circuits within the brain, with particular attention being paid to the cerebellar granular layer. The focus of this study is to evaluate the input activity representation of these feed-forward neural networks. The activity of cerebellar granule cells is conveyed by parallel fibers and translated into Purkinje cell activity, which constitutes the sole output of the cerebellar cortex. The learning process at this parallel-fiber-to-Purkinje-cell connection makes each Purkinje cell sensitive to a set of specific cerebellar states, which are roughly determined by the granule-cell activity during a certain time window. A Purkinje cell becomes sensitive to each neural input state and, consequently, the network operates as a function able to generate a desired output for each provided input by means of supervised learning. However, not all sets of Purkinje cell responses can be assigned to any set of input states due to the network's own limitations (inherent to the network neurobiological substrate), that is, not all input-output mapping can be learned. A key limiting factor is the representation of the input states through granule-cell activity. The quality of this representation (e.g., in terms of heterogeneity) will determine the capacity of the network to learn a varied set of outputs. Assessing the quality of this representation is interesting when developing and studying models of these networks to identify those neuron or network characteristics that enhance this representation. In this study we present an algorithm for evaluating quantitatively the level of compatibility/interference amongst a set of given cerebellar states according to their representation (granule-cell activation patterns) without the need for actually conducting simulations and network training. The algorithm input consists of a real-number matrix that codifies the activity level of every considered granule-cell in each state. The capability of this representation to generate a varied set of outputs is evaluated geometrically, thus resulting in a real number that assesses the goodness of the representation.

Keywords: cerebellum; convex geometry; granular layer; high dimensionality; inferior colliculus; non-negativity constraints; population coding; supervised learning.


Figures

Figure 1
Figure 1
Network connections for supervised learning. The input state is encoded by the activity of neurons i1,…,in. These neurons are mainly granule cells in the cerebellum, or central-nucleus neurons of the inferior colliculus in the midbrain, depending on the network being considered. Each teaching neuron (p1,…,pj) (inferior-olive or optic-tectum neurons) modulates iterative modifications of the network weights (W) adjusting the network-output behavior. For each input state the desired output-activity pattern is generated by readout neurons o1,…,oj (Purkinje cells in the cerebellum, or external-nucleus neurons in the inferior colliculus).
Figure 2
Figure 2
Representation of input states. This figure illustrates a network with 3 input neurons (i1, i2, i3) and 4 different input states. (A) The input states are presented to the output neuron throughout time. Each state requires one time slot (ts) to be presented to the output neuron (o). (B) The set of distinct input states is represented by the matrix C. Each element of this matrix encodes the number of spikes elicited by the input neuron corresponding to that matrix column. Each matrix row denotes the input activity during a particular state. The output d is computed by the weighted sum (w1, w2, w3) of inputs for each state.
Figure 3
Figure 3
Evaluation of the representation error for a 2-state-and-4-input-neuron network. The output error performed by a readout neuron using the 2-input-state representation matrix C is depicted in a two-dimensional space. The square of size 1 (delimited by the red line) contains the space of potentially desired outputs considered by the evaluation function ([0, 1]2). That is, the 2 coordinates of each point in this square codify a potentially desired output for the 2 input states. u1, u2, u3, and u4 refer to the columns of C represented as vectors. Coni(C) is the conical hull of the column vectors of C, represented by the light purple cone area. This cone covers the space of outputs that can be generated by the readout neuron. ddes and d^ denote a potentially desired readout-neuron output and the better (closest) approximation obtained, respectively. ||ddes- d^||2 corresponds to the l2 norm of the residual vector, which is the minimal distance from ddes to the conical hull; therefore, this residual vector is normal to the hull face (u1). The squared l2 norm of the residual vector is integrated over this square to evaluate the input-representation error (Ir(C)) corresponding to C. Cone(C) ⋂ [0, 1]2 is the area of the square (hatched with dark blue lines) over which the l2 norm is 0 (the readout neuron can obtain these desired output values). Consequently, the squared l2 norm only has to be integrated over the region [0, 1]2Cone(C) (gray area).
Figure 4
Figure 4
Evaluation of the representation error for a 3-state-and-3-input-neuron network. u1, u2, and u3 represent the column vectors of C. The conical hull of these vectors is represented by the cube central empty space. The input-representation error corresponding to this matrix (Ir(C)) is calculated by integrating the squared l2 norm of the residual vector over the cube of size 1 delimited by the thin yellow line ([0, 1]3). The integration over this cube is divided into five regions, corresponding to the red, blue, green, magenta and orange polyhedrons. These regions are determined by the geometry of the cone defined by matrix C. The region corresponding to the empty space does not need to be considered since its integral is 0. The five integrals are summed to obtain Ir(C).
Figure 5
Figure 5
Calculation of the evaluation function. The computation of Ir(C) can be decomposed into a series of sub-calculations (numbered here from 0 to 5). Text in blue indicates the general calculation procedure and text in black provides the particular calculation results when using the previous 3-by-3 matrix C. These sub-calculations are also represented graphically in a three-dimensional space, since the column vectors of matrix C (u1, u2, and u3) have 3 components each. Sub-calculations 2, 3, 4, and 5 must be repeated for every geometrical element of the initial cone (in the case of this matrix C the initial cone comprises 6 elements: 3 faces and 3 edges), but for the sake of brevity we only show these sub-calculations for the edge u1. Therefore, the calculation of only 1 adjacent cone (Ru1) is showed. nul,uk denotes an unit vector that is normal to the initial-cone face {ul, uk}, that is, the face defined by rays ul and uk. This adjacent cone leads to the calculation of its intersection with the cube (Iu1) and the integration (Iru1) of the squared distance over the corresponding polyhedron (Su1). The intersection is decomposed into groups of sub-intersections (in the case of this matrix C we have 3 groups, one for each element type of the adjacent cone: edges, faces, and cone inside). iul denotes the point resulting from the intersection of cone edge ul and a cube face, iul,nk,p denotes the intersection point for cone face {ul, nk,p} and a cube edge, and iul,nk,p,ns,t denotes the intersection point for cone (inside) {ul, nk,p, ns,t} and a cube vertex.
Figure 6
Figure 6
Numerical calculation of the representation error for a 3-state-and-3-input-neuron network. u1, u2, and u3 represent the column vectors of C. The approximate input-representation error corresponding to this matrix (Ir_num(C, N)) is calculated by numerically integrating the squared l2 norm of the residual vector over the cube of size 1 delimited by the thin yellow line ([0, 1]3). To this end, this cube is divided into smaller cubes; the center point of each small cube represents a desired solution (ddes) for which the residual vector is calculated. The total cube is divided into 163 cubes for our particular case (N = 16 cubes to evaluate in each dimension). The color of each small cube represents the squared distance (squared l2 norm) from its center to the conical hull of C (possible outputs). When this distance is zero, the small cube is not drawn for clarity. Then the squared l2 norm of the residual vectors (for each desired output) is averaged to obtain Ir_num(C, N) (midpoint rule).
Figure 7
Figure 7
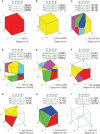
Analytical calculation and graphic representation of the input-representation error (Ir(C)) for a 3-state and 4-input-neuron network. Nine input matrices C are evaluated, from worst (A) to best-case representation (I) by way of intermediate cases (B-H). In each case, the input matrix C and its corresponding activity representation (spikes) are shown. The four input neurons (N. 1,…, N. 4) are represented in a three-dimensional space (3 states: St. 1,…, St. 3) by four vectors (colored in cyan), constituting the columns of the input matrix. Redundant vectors (neurons), those that are not extreme rays of the cone, can be identified (they are not edges of the cone). Ir(C) is calculated by integrating the squared l2 norm of the residual vector over the cube [0, 1]3 (Ir(C) and volume values are expressed with a precision of 4 decimal places). The cube is partitioned into regions (colored polyhedrons) over which the squared l2 norm is integrated. The volume of the outputs achieved by the network is also calculated. This volume is represented by the empty space in the cube not occupied by any polyhedron. A larger volume of achieved output values usually results in a better input representation (lower Ir(C)), particularly when the volume is centered in the cube.
Figure 8
Figure 8
Numerical vs. analytical calculation of the representation error for a 3-state and 3-input-neuron network. The representation error of the previous 3-input state matrix C is calculated numerically (red line) and analytically (blue line). The numerical integration is calculated for several integration resolutions (from 1 to 20 points per dimension) using the midpoint rule as described in the methods section. In this case (of the 3 input states), the representation error values (Ir(C)) are already normalized (Ir(C) = IrN(C)).

References

    1. Abbott L. F., Regehr W. G. (2004). Synaptic computation. Nature 431, 796–803. 10.1038/nature03010 - DOI - PubMed
    1. Albus J. S. (1971). The theory of cerebellar function. Math. Biosci. 10, 25–61. 10.1016/0025-5564(71)90051-4 - DOI
    1. Albus J. S. (1975). A new approach to manipulator control: The cerebellar model articulation controller (CMAC). J. Dyn. Syst. Measure. Control 97, 220–227. 10.1115/1.3426922 - DOI
    1. Arfken G. (1985). Gram-Schmidt Orthogonalization, Mathematical Methods for Physicists, 3rd Edn. Orlando, FL: Academic; Press, 516–520.
    1. Avis D. (1980). On the extreme rays of the metric cone. Can. J. Math. 32, 126–144. 10.4153/CJM-1980-010-0 - DOI

LinkOut - more resources