. 2018 Dec 18:11:454.
doi: 10.3389/fnmol.2018.00454. eCollection 2018.

Effects of APOE Genotype on Brain Proteomic Network and Cell Type Changes in Alzheimer's Disease

Affiliations

Effects of APOE Genotype on Brain Proteomic Network and Cell Type Changes in Alzheimer's Disease

Jingting Dai et al. Front Mol Neurosci. .

Abstract

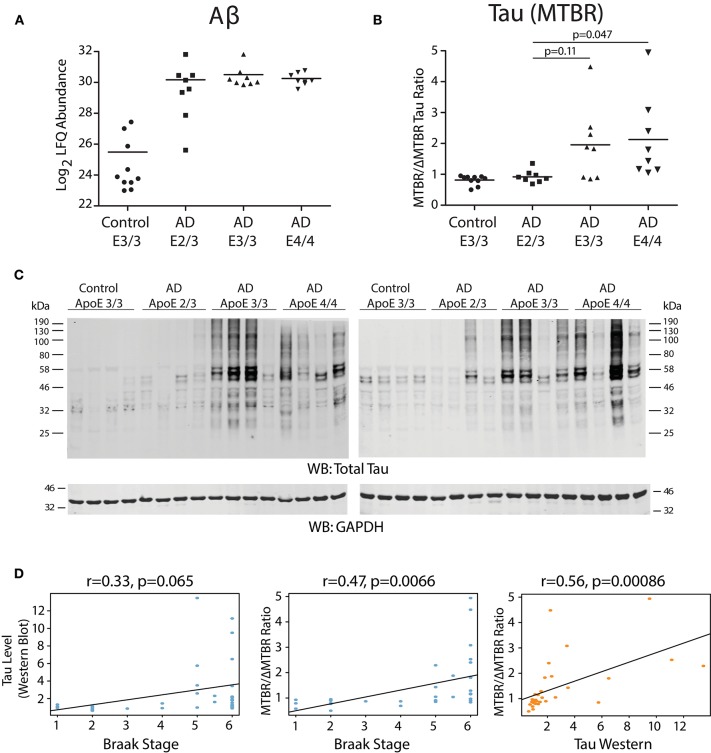
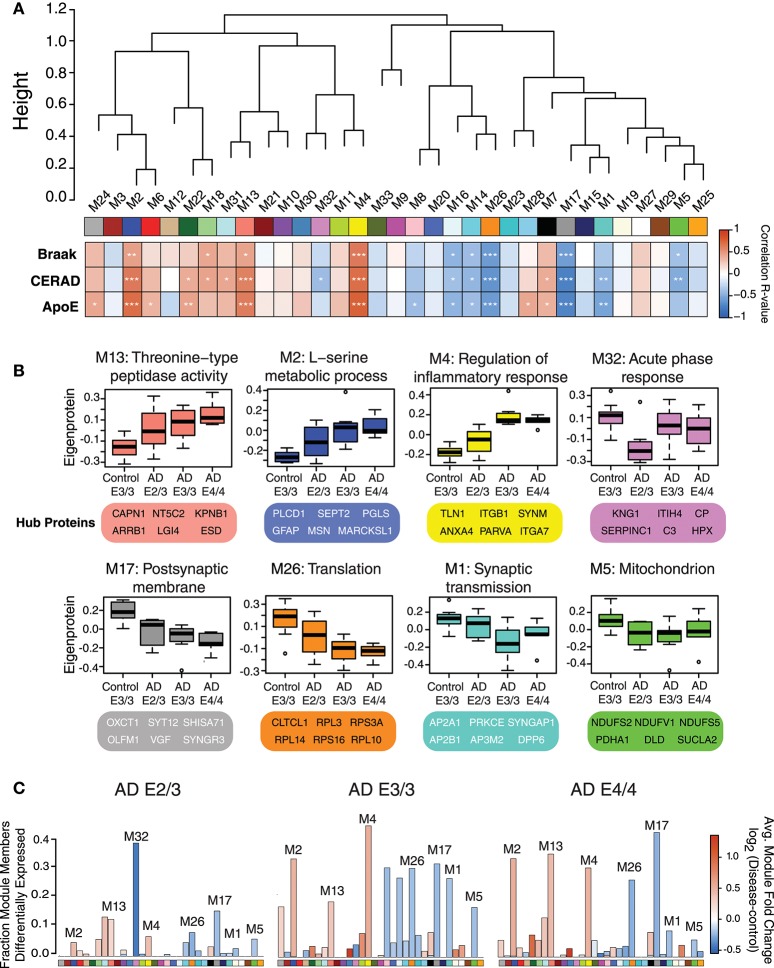
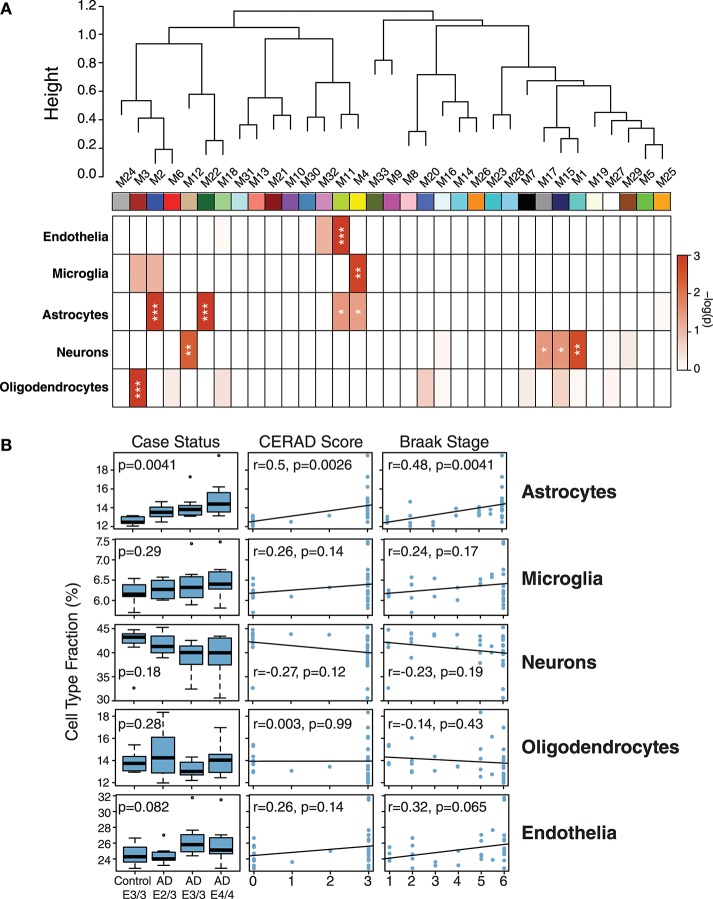
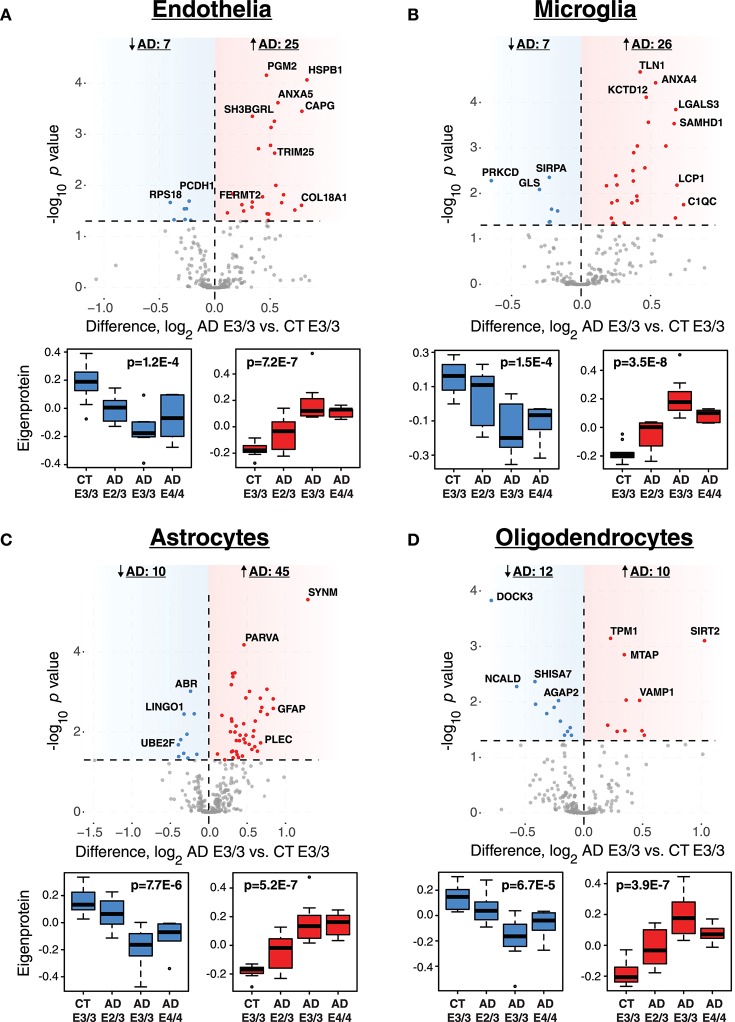
Polymorphic alleles in the apolipoprotein E (APOE) gene are the main genetic determinants of late-onset Alzheimer's disease (AD) risk. Individuals carrying the APOE E4 allele are at increased risk to develop AD compared to those carrying the more common E3 allele, whereas those carrying the E2 allele are at decreased risk for developing AD. How ApoE isoforms influence risk for AD remains unclear. To help fill this gap in knowledge, we performed a comparative unbiased mass spectrometry-based proteomic analysis of post-mortem brain cortical tissues from pathologically-defined AD or control cases of different APOE genotypes. Control cases (n = 10) were homozygous for the common E3 allele, whereas AD cases (n = 24) were equally distributed among E2/3, E3/3, and E4/4 genotypes. We used differential protein expression and co-expression analytical approaches to assess how changes in the brain proteome are related to APOE genotype. We observed similar levels of amyloid-β, but reduced levels of neurofibrillary tau, in E2/3 brains compared to E3/3 and E4/4 AD brains. Weighted co-expression network analysis revealed 33 modules of co-expressed proteins, 12 of which were significantly different by APOE genotype in AD. The modules that were significantly different by APOE genotype were associated with synaptic transmission and inflammation, among other biological processes. Deconvolution and analysis of brain cell type changes revealed that the E2 allele suppressed homeostatic and disease-associated cell type changes in astrocytes, microglia, oligodendroglia, and endothelia. The E2 allele-specific effect on brain cell type changes was validated in a separate cohort of 130 brains. Our systems-level proteomic analyses of AD brain reveal alterations in the brain proteome and brain cell types associated with allelic variants in APOE, and suggest further areas for investigation into the upstream mechanisms that drive ApoE-associated risk for AD.

Keywords: Alzheimer's disease; apolipoprotein E; deconvolution; inflammation; proteomics.


Figures

Figure 1
Figure 1
Effect of APOE Genotype on Amyloid-β and Tau Levels in AD Brain. (A–D) Amyloid-β (Aβ) levels in control and Alzheimer disease (AD) dorsolateral prefrontal cortex (DLPFC) brain region by APOE genotype, as measured by levels of the Aβ6−16 and Aβ17−28 peptides (see Methods) (A). Levels of Aβ were not different among AD case groups by one-way ANOVA with Tukey's test. (B) Tau levels in control and AD DLPFC brain by APOE genotype as measured by the ratio of tau protein consisting of the microtubule-binding domain region (MTBR) only to the tau protein excluding the MTBR region (ΔMTBR). For illustration of tau protein level heterogeneity by protein region, see Supplementary Figure 1A. Levels of tau in AD E2/3 brains were significantly less than in AD E4/4 brains, were nearly significantly less than in AD E3/3 brains, and were not different from control E3/3 brains, by one-way ANOVA with Tukey's test. (C) Tau levels by western blotting for total tau using the Tau-5 antibody. Total tau levels by label-free quantification mass spectrometry (LFQ-MS) are shown in Supplementary Figure 1B. (D) Correlation between tau levels as measured by western blot densitometry to Braak stage (left panel), tau levels as measured by MTBR/ΔMTBR LFQ-MS to Braak stage (center panel), and tau levels as measured by MTBR/ΔMTBR LFQ-MS to western blot densitometry (right panel). Densitometry measurements are a sum of all tau species stained by the Tau-5 antibody. Correlations were performed using biweight midcorrelation (bicor).
Figure 2
Figure 2
Protein Coexpression Network and Differential Abundance by APOE Genotype in AD. (A–C) Weighted Protein Correlational Network Analysis (WPCNA) was performed on 32 control and AD cases, and the resulting module eigenproteins were correlated to tau tangle burden (Braak stage), neuritic amyloid plaque burden (CERAD score), and APOE genotype using an ordinal scale where an E2 allele = −1, E3 = 0, and E4 = 1 (see main text) (A). Strength of correlation to each trait is shown by heatmap, where red indicates positive correlation, and blue indicates negative correlation. Module-trait correlations were performed using biweight midcorrelation (bicor). *p < 0.05, **p < 0.01, ***p < 0.001. (B) Selected modules that showed significant trait correlations were analyzed by gene ontology (GO) analysis, with the resulting top GO term for each module listed as the module description. The most highly correlated proteins within each module (“hub proteins”) are listed below each module. Module eigenprotein values are plotted in control and AD APOE genotypes. (C) Differential protein abundance for each AD case group compared to control E3/3, by module. The height of the bars represents the fraction of module member proteins that had a difference in abundance compared to control. The bars are color coded by heatmap for average log2 difference in abundance, where red represents an increase in abundance in AD, and blue represents a decrease in abundance in AD.
Figure 3
Figure 3
Network Module Cell Type Enrichment and Effect of APOE Genotype on Cell Type Changes in AD. (A,B) Cell type protein markers for microglia, astrocytes, neurons, and oligodendrocytes (Sharma et al., 2015)—and mRNA markers from endothelial cells (Zhang et al., 2014b)—from purified brain cell types were used to assess cell type enrichment for each network module by Fisher's exact test (A). Significance of enrichment for a given cell type is shown by one-color heat map, with p values provided for selected cell type overlaps in Supplementary Table 3. P values were corrected by the Benjamini-Hochberg false discovery rate method. *p < 0.05, **p < 0.01, ***p < 0.001. (B) Cell type fraction estimation in control and AD cases by APOE genotype, and correlation of cell type fraction with amyloid plaque burden (CERAD score) and tau neurofibrillary tangle burden (Braak stage). Differences in cell type fraction among control and AD cases were assessed after one-way ANOVA. Correlations were performed using biweight midcorrelation (bicor).
Figure 4
Figure 4
Differential Expression of Cell Type Markers in AD and Effects of APOE Genotype on Marker Expression. (A–D) Cell type markers for endothelia (A), microglia (B), astrocytes (C), and oligodendrocytes (D) were analyzed for significant changes between control and AD on the ApoE 3/3 background. For those markers that were significantly increased (red) or decreased (blue) in AD E3/3 compared to control E3/3 brains (p < 0.05), a synthetic eigenprotein was generated for the significantly increased or decreased protein groups and analyzed for changes across APOE genotype by one-way ANOVA with Tukey's test. P values for one-way ANOVA are given in the box plots. Differences between AD E2/3 and control E3/3 were insignificant, while differences between AD E2/3 and AD E3/3 were significant, for decreased (or “homeostatic”) cell type marker eigenproteins for all cell types except endothelia (not significant for either comparison). Differences between AD E2/3 and AD E3/3 were significant for all increased (or “disease-associated”) cell type marker eigenproteins, while differences between AD E2/3 and control E3/3 were insignificant only for astrocytes (p = 0.06) and endothelia (p = 0.11). For a list of all p values after Tukey's test and a description of all markers, see Supplementary Data. CT, control; AD, Alzheimer's disease.

References

    1. Beach T. G., Adler C. H., Sue L. I., Serrano G., Shill H. A., Walker D. G., et al. . (2015). Arizona study of aging and neurodegenerative disorders and brain and body donation program. Neuropathology 35, 354–389. 10.1111/neup.12189 - DOI - PMC - PubMed
    1. Bell R. D., Winkler E. A., Singh I., Sagare A. P., Deane R., Wu Z., et al. . (2012). Apolipoprotein E controls cerebrovascular integrity via cyclophilin A. Nature 485, 512–516. 10.1038/nature11087 - DOI - PMC - PubMed
    1. Berlau D. J., Corrada M. M., Head E., Kawas C. H. (2009). APOE epsilon2 is associated with intact cognition but increased Alzheimer pathology in the oldest old. Neurology 72, 829–834. 10.1212/01.wnl.0000343853.00346.a4 - DOI - PMC - PubMed
    1. Biffi A., Anderson C. D., Jagiella J. M., Schmidt H., Kissela B., Hansen B. M., et al. . (2011). APOE genotype and extent of bleeding and outcome in lobar intracerebral haemorrhage: a genetic association study. Lancet Neurol. 10, 702–709. 10.1016/S1474-4422(11)70148-X - DOI - PMC - PubMed
    1. Biffi A., Sonni A., Anderson C. D., Kissela B., Jagiella J. M., Schmidt H., et al. . (2010). Variants at APOE influence risk of deep and lobar intracerebral hemorrhage. Ann Neurol. 68, 934–943. 10.1002/ana.22134 - DOI - PMC - PubMed