. 2018 Dec 18:12:509.
doi: 10.3389/fnhum.2018.00509. eCollection 2018.

EEG-Based Mental Workload Neurometric to Evaluate the Impact of Different Traffic and Road Conditions in Real Driving Settings

Affiliations

EEG-Based Mental Workload Neurometric to Evaluate the Impact of Different Traffic and Road Conditions in Real Driving Settings

Gianluca Di Flumeri et al. Front Hum Neurosci. .

Abstract

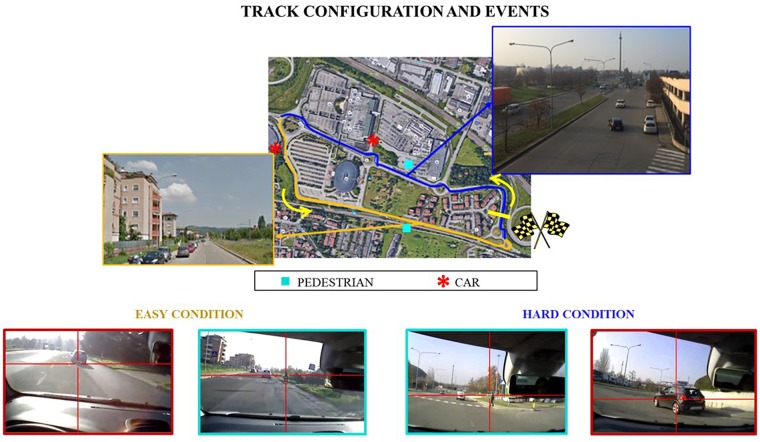
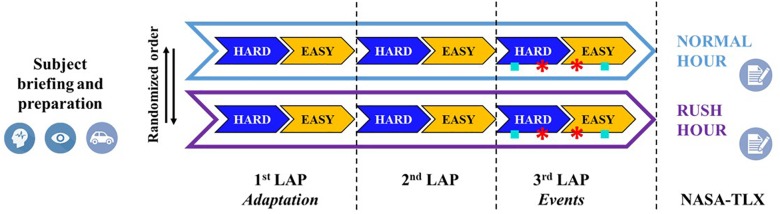
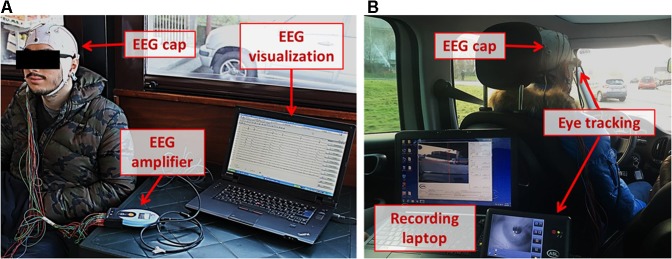
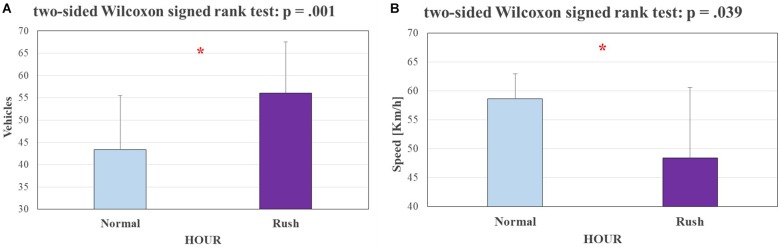
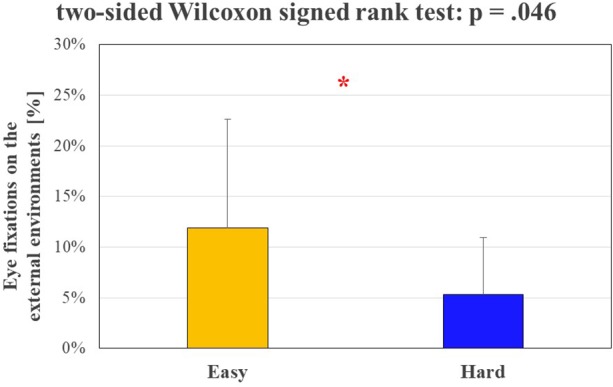
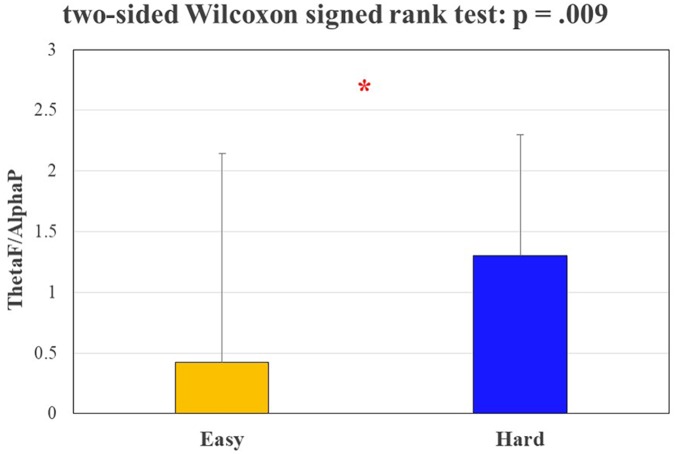
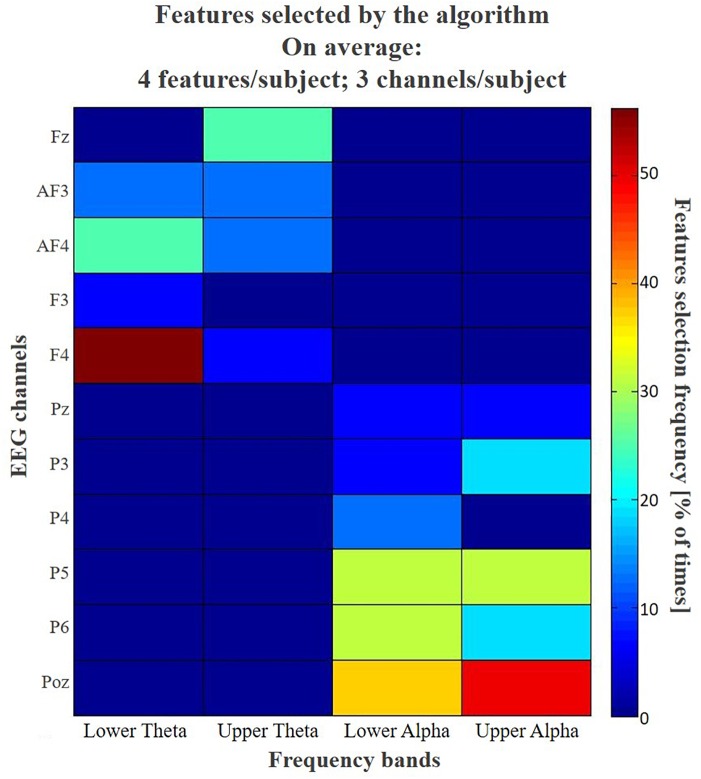
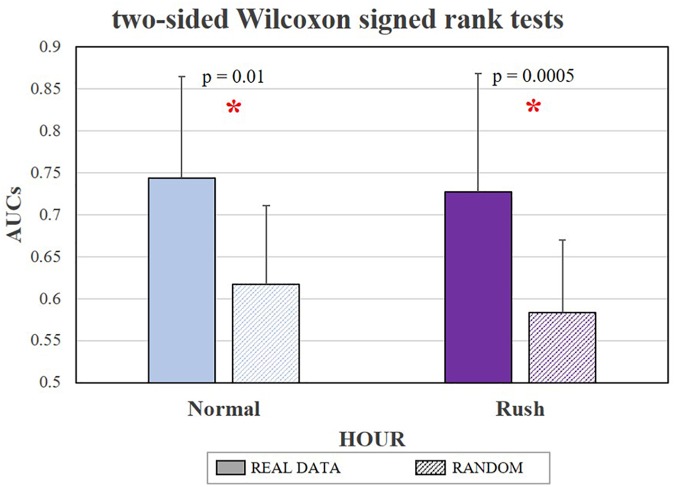
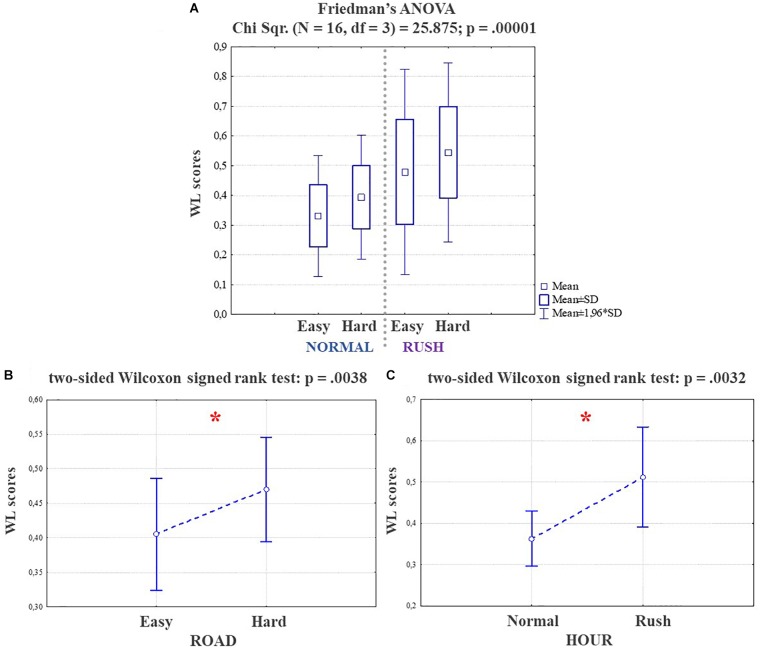
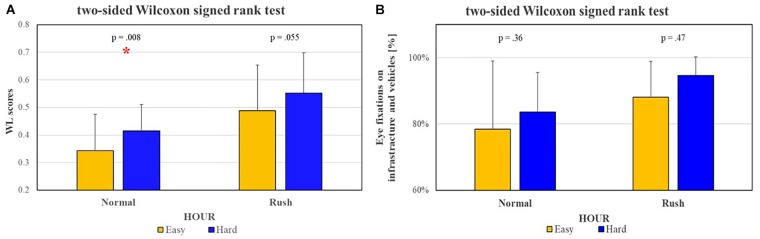
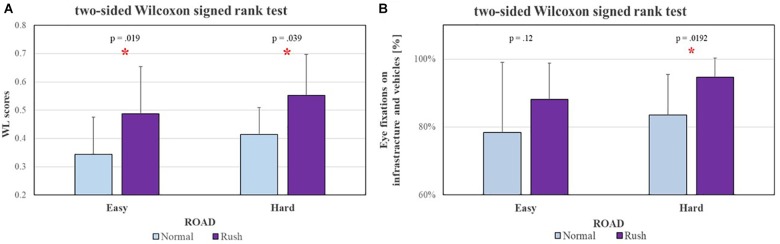
Car driving is considered a very complex activity, consisting of different concomitant tasks and subtasks, thus it is crucial to understand the impact of different factors, such as road complexity, traffic, dashboard devices, and external events on the driver's behavior and performance. For this reason, in particular situations the cognitive demand experienced by the driver could be very high, inducing an excessive experienced mental workload and consequently an increasing of error commission probability. In this regard, it has been demonstrated that human error is the main cause of the 57% of road accidents and a contributing factor in most of them. In this study, 20 young subjects have been involved in a real driving experiment, performed under different traffic conditions (rush hour and not) and along different road types (main and secondary streets). Moreover, during the driving tasks different specific events, in particular a pedestrian crossing the road and a car entering the traffic flow just ahead of the experimental subject, have been acted. A Workload Index based on the Electroencephalographic (EEG), i.e., brain activity, of the drivers has been employed to investigate the impact of the different factors on the driver's workload. Eye-Tracking (ET) technology and subjective measures have also been employed in order to have a comprehensive overview of the driver's perceived workload and to investigate the different insights obtainable from the employed methodologies. The employment of such EEG-based Workload index confirmed the significant impact of both traffic and road types on the drivers' behavior (increasing their workload), with the advantage of being under real settings. Also, it allowed to highlight the increased workload related to external events while driving, in particular with a significant effect during those situations when the traffic was low. Finally, the comparison between methodologies revealed the higher sensitivity of neurophysiological measures with respect to ET and subjective ones. In conclusion, such an EEG-based Workload index would allow to assess objectively the mental workload experienced by the driver, standing out as a powerful tool for research aimed to investigate drivers' behavior and providing additional and complementary insights with respect to traditional methodologies employed within road safety research.

Keywords: asSWLDA; car driving; electroencephalography; human factor; machine-learning; mental workload; neuroergonomics; road safety.


Figures

FIGURE 1
FIGURE 1
The experimental circuit about 2500 m long along Bologna roads. The blue line indicates the circuit segment labeled as “Hard” in terms of road complexity, while the yellow one the “Easy” segment. The cyan squares and the red asterisks represent the points were the events, respectively the pedestrian and the car, have been acted along the 3rd lap of both the task repetitions.
FIGURE 2
FIGURE 2
Overview of the experimental protocol, consisting of two main driving tasks different in terms of traffic (normal and rush hour) and performed in a randomized order. Each task consisted of three laps along the circuit in Figure 1: the first lap aimed to allow the driver to take confidence with the circuit, while the second and third lap have been used for analysis. In particular, during the third lap four events have been acted as indicated in Figure 1. Before the experiment the participant received a briefing and was equipped by EEG and Eye Tracking devices, while his car with Video VBOX system. At the end of each task the participant had to fill a questionnaire (NASA-TLX) about the experienced mental workload.
FIGURE 3
FIGURE 3
On the left (A), the participant preparation phase. In particular, the EEG signal has been acquired through the EEG amplifier in holter modality: the EEG signal and the electrodes impedances were checked on a computer before starting the experiments. On the right (B), a picture representing the experimental setup within the car: in particular, other than the EEG cap, also the Eye Tracking device and its recording laptop are shown. The subject in picture, as all the participants, gave their signed authorization to use the video graphical material for dissemination purposes.
FIGURE 4
FIGURE 4
On the left (A), a bar graph representing the mean and the standard deviation of vehicles encountered by the participants during the experiments. The Wilcoxon test showed a significantly higher (p = 0.001) number of vehicles during rush hour. On the right (B), a bar graph representing the mean and the standard deviation of participants driving speed during the experiments. The Wilcoxon test showed a significantly lower (p = 0.039) speed during rush hour. The statistical tests showing a significant effect.
FIGURE 5
FIGURE 5
The bar graph represents the mean and the standard deviation of the percentage of drivers’ eye fixations along the two different segments of the circuit. The Wilcoxon test showed a significant reduction (p = 0.046) of such percentage during the circuit segment characterized by hard complexity. The statistical tests showing a significant effect.
FIGURE 6
FIGURE 6
The bar graph represents the mean and the standard deviation of the EEG-based ThetaF/AlphaP indicator along the two different segments of the circuit. The Wilcoxon test showed a significant increasing (p = 0.009) of such indicator during the circuit segment characterized by hard complexity. The statistical tests showing a significant effect.
FIGURE 7
FIGURE 7
The colormap summarizes the frequency of the selection of each feature for the whole subjects’ sample. The initial features domain for each subject consisted of a matrix of 187 features (11 EEG channels 17 bins of frequency – from IAF – 6 Hz to IAF+2 Hz with a resolution of 0.5 Hz –). Actually, only 99 of these features can be selected by the algorithm, because of the Regions of Interest defined a priori: 45 features related to frontal Theta and 54 related to parietal Alpha. For a synthetic and effective representation, the frequency bins, actually equal to 17 because included between IAF-6 Hz and IAF+2 Hz with a resolution of 0.5 Hz, have been grouped into four areas of interest: Lower Theta [IAF – 6 ÷ IAF – 4], Upper Theta [IAF – 4 ÷ IAF – 2], Lower Alpha [IAF – 2 ÷ IAF] and Upper Alpha [IAF ÷ IAF + 2]. The results show that Lower Theta over F4 and Upper Alpha over POz have been used for more than the 50% of subjects.
FIGURE 8
FIGURE 8
The bar graph represents the mean and the standard deviation of AUC values obtained in discriminating the Easy and Hard circuit segments. Both in Normal and Rush hour conditions, the classification performance obtained by training the classifier with real data (solid color) have been significantly higher (respectively p = 0.01 and p = 0.0005) than by using random data (lines pattern), achieving mean AUC values of respectively 0.74 and 0.73. The statistical tests showing a significant effect.
FIGURE 9
FIGURE 9
At the top (A), the Friedman test highlighting a significant main effect (p = 0.00001), in terms of mental workload increasing among the different factors. At the bottom, on the left (B) the Wilcoxon test on the factor ROAD and on the right (C) the same test on the factor HOUR, showing how both the factors produced a significant mental workload increasing (respectively p = 0.004 and p = 0.003). The statistical tests showing a significant effect.
FIGURE 10
FIGURE 10
The Wilcoxon tests performed to investigate eventual sensitivity differences between Eye-Tracking [left (A)] and EEG [right (B)] measures, considered on the same subjects, in relation to ROAD complexity showed that EEG-based measures have been able to significantly discriminate (p = 0.008) the two conditions at least during Normal hour, while the ET-based ones have not been able to show any significant difference both during Normal and Rush hours. The statistical tests showing a significant effect.
FIGURE 11
FIGURE 11
The Wilcoxon tests performed to investigate eventual sensitivity differences between Eye-Tracking [left (A)] and EEG [right, (B)] measures, considered on the same subjects, in relation to traffic intensity (i.e., HOUR) showed that, while the EEG-based measures have been able to significantly discriminate the two conditions both along Easy (p = 0.019) and Hard (p = 0.04) segments, the ET-based ones have been able to significantly discriminate Normal and Rush hours only along the Hard segment (p = 0.02). The statistical tests showing a significant effect.
FIGURE 12
FIGURE 12
The bar graph represents the mean and the standard deviation of NASA-TLX scores, i.e., the subjective assessment of the mental workload experienced by the participants of the circuit. The Wilcoxon test does not reveal any significant difference in terms of workload subjectively assessed by the subjects between the Normal and Rush hour conditions.
FIGURE 13
FIGURE 13
The bar graphs show the mean values and the standard deviation of the EEG-based WL scores related to the different events along the various experimental conditions. In particular, the results are divided per events category, i.e., Pedestrian on the left (A) and Car on the right (B). In both the cases, the condition EVENT (solid color) is referred to the event actually happened during the 3rd lap, the condition NO EVENT (lines pattern) is referred to the same circuit portion during the 2nd lap when no events were acted. The Wilcoxon tests revealed a significant workload increasing (one red asterisk stands for p < 0.05; two red asterisks stand for p < 0.01) related to both the investigated events, that is the car and the pedestrian crossing the road, especially in normal hours independently from the road complexity. Instead, no significant workload increasing were associated to the event during rush hours, despite a significantly higher workload in comparison with the same events during normal hours.

References

    1. Allnutt M. F. (1987). Human factors in accidents. Br. J. Anaesth. 59 856–864. 10.1093/bja/59.7.856 - DOI - PubMed
    1. Aricò P., Borghini G., Di Flumeri G., Babiloni F. (2017a). Method for Estimating a Mental State, in Particular a Workload, and Related Apparatus. EP3143933 A1, filed September 14, 2016, and issued March 22, 2017. Available at: http://www.google.it/patents/EP3143933A1
    1. Aricò P., Borghini G., Di Flumeri G., Bonelli S., Golfetti A., Graziani I., et al. (2017b). Human factors and neurophysiological metrics in air traffic control: a critical review. IEEE Rev. Biomed. Eng. 10 250–263. 10.1109/RBME.2017.2694142 - DOI - PubMed
    1. Aricò P., Borghini G., Di Flumeri G., Sciaraffa N., Colosimo A., Babiloni F. (2017c). Passive BCI in operational environments: insights, recent advances, and future trends. IEEE Trans. Biomed. Eng. 64 1431–1436. 10.1109/TBME.2017.2694856 - DOI - PubMed
    1. Aricò P., Borghini G., Di Flumeri G., Colosimo A., Bonelli S., Golfetti A., et al. (2016a). Adaptive automation triggered by eeg-based mental workload index: a passive brain-computer interface application in realistic air traffic control environment. Front. Hum. Neurosci. 10:539. 10.3389/fnhum.2016.00539 - DOI - PMC - PubMed

LinkOut - more resources