Review
. 2018 Dec 11:9:1773.
doi: 10.3389/fphys.2018.01773. eCollection 2018.

Dyadic Plasticity in Cardiomyocytes

Affiliations
Review

Dyadic Plasticity in Cardiomyocytes

Peter P Jones et al. Front Physiol. .

Abstract

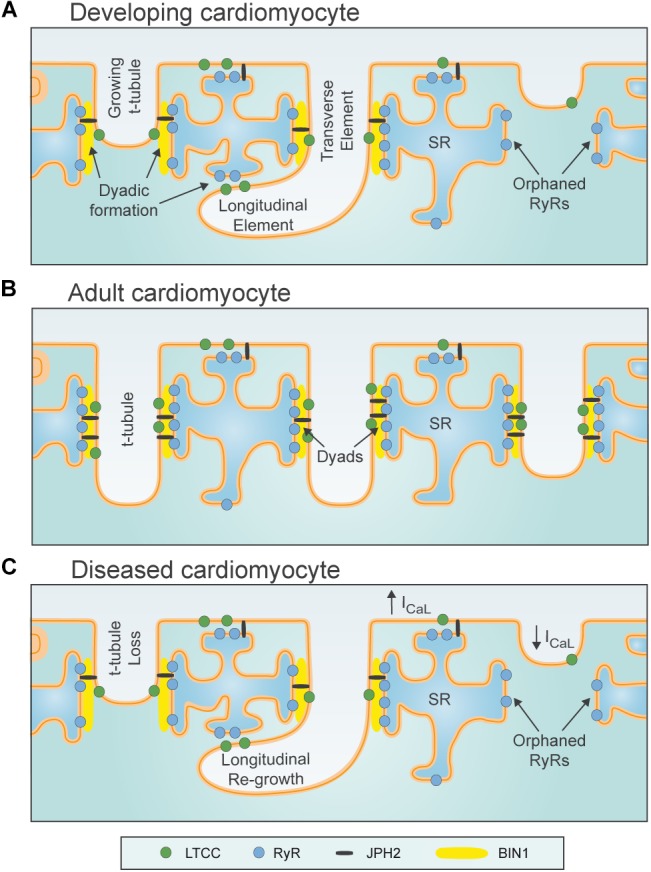
Contraction of cardiomyocytes is dependent on sub-cellular structures called dyads, where invaginations of the surface membrane (t-tubules) form functional junctions with the sarcoplasmic reticulum (SR). Within each dyad, Ca2+ entry through t-tubular L-type Ca2+ channels (LTCCs) elicits Ca2+ release from closely apposed Ryanodine Receptors (RyRs) in the SR membrane. The efficiency of this process is dependent on the density and macroscale arrangement of dyads, but also on the nanoscale organization of LTCCs and RyRs within them. We presently review accumulating data demonstrating the remarkable plasticity of these structures. Dyads are known to form gradually during development, with progressive assembly of both t-tubules and junctional SR terminals, and precise trafficking of LTCCs and RyRs. While dyads can exhibit compensatory remodeling when required, dyadic degradation is believed to promote impaired contractility and arrythmogenesis in cardiac disease. Recent data indicate that this plasticity of dyadic structure/function is dependent on the regulatory proteins junctophilin-2, amphiphysin-2 (BIN1), and caveolin-3, which critically arrange dyadic membranes while stabilizing the position and activity of LTCCs and RyRs. Indeed, emerging evidence indicates that clustering of both channels enables "coupled gating", implying that nanoscale localization and function are intimately linked, and may allow fine-tuning of LTCC-RyR crosstalk. We anticipate that improved understanding of dyadic plasticity will provide greater insight into the processes of cardiac compensation and decompensation, and new opportunities to target the basic mechanisms underlying heart disease.

Keywords: calcium homeostasis; development; disease; dyad; sarcoplasmic reticulum; t-tubule.


Figures

FIGURE 1
FIGURE 1
Plasticity of dyadic structure in ventricular cardiomyocytes. (A) Dyads form gradually in developing ventricular cardiomyocytes, as growing t-tubules extend the surface sarcolemma into the cell interior, initially in a largely longitudinal orientation. Rudimentary junctional SR terminals and contained ryanodine receptors (RyRs) are present in advance of t-tubule arrival. Formation of dyadic junctions between L-type Ca2+ channels (LTCCs) and RyRs requires the anchoring protein Junctophilin (JPH2), and the membrane sensing and bending protein BIN1. (B) Dyadic density increases toward adulthood, and assumes a predominantly transverse orientation. (C) During diseases such as heart failure, levels of JPH2 and BIN1 decline, and ventricular cardiomyocytes exhibit loss of t-tubules and SR. However, new dyads in the longitudinal orientation reappear, in resemblance to developing cells. T-tubule function also declines during heart failure, as L-type Ca2+ current (ICaL) is shifted to the surface sarcolemma.
FIGURE 2
FIGURE 2
T-tubule plasticity during development and heart failure. (A) Confocal imaging of rat cardiomyocytes isolated at a range of post-natal time points reveals progressive t-tubule growth. T-tubules initially appear as a sparse network which is largely oriented in the longitudinal orientation, before the dense, predominantly transverse network is established in adulthood (whole cell images at left, with enlargements at right; adapted from Ziman et al. (2010); scale bar = 10 μm, copyright permission to reproduce the figure). (B) Typical t-tubule remodeling during heart failure exhibits a return to an immature phenotype, with loss of transverse elements and re-appearance of longitudinal elements (arrows). In a post-infarction rat model of heart failure, it was observed that remodeling is most marked proximal to the infarction scar, where in vivo wall stress is particularly elevated (adapted from Frisk et al. (2016), copyright permission to reproduce the figure). These data contribute to a growing understanding that high workload/wall stress signals t-tubule remodeling in this condition (reviewed in Ibrahim and Terracciano, 2013; Manfra et al., 2017).
FIGURE 3
FIGURE 3
New insights into t-tubule remodeling during human heart failure. In comparison with ventricular tissue obtained from healthy donor hearts (A) tissue from heart failure patients undergoing transplant (B) revealed dilation of t-tubules associated with collagen deposition within the t-tubule lumen. Images were obtained with dSTORM super-resolution microscopy with staining for collagen VI (red) and dystrophin (green); enlargements of the indicated regions are shown at right (adapted from Crossman et al., 2017, copyright permission to reproduce the figure). Other recent work has indicated that in addition to t-tubule loss, cardiomyocytes in heart failure patients exhibit fusion of neighboring t-tubules into sheet-like structures (donor example in C, heart failure patient in D). 3D reconstructions illustrate the surface sarcolemma (gray) and t-tubules (blue), with the indicated tubule enlarged at right (longitudinal and transverse views; left scale bar = 10 μm, right scale bar = 2 μm; adapted from Seidel et al., 2017a, copyright permission to reproduce the figure).
FIGURE 4
FIGURE 4
EM imaging of dyadic structure. (A) Block-face scanning EM performed on a sheep cardiomyocyte illustrates the complex, mesh-like nature of 3D SR structure (red), and it’s interrelationship with t-tubules (gray). Both longitudinal and perpendicular elements (arrows) are readily apparent, which converge to engulf t-tubules (enlarged region). Occasional twinning of t-tubules was observed with surrounding junctional SR (dashed elipsoid) (adapted from Pinali et al., 2013, copyright permission to reproduce the figure). Transmission EM imaging of transversely (B) and longitudinally-oriented dyads (C) revealed similar geometries, suggesting similar functionality of these structures (t, t-tubule; m, mitochondrion; double arrow, SR; scale bar in C = 100 nm). Ryanodine receptor heads are readily apparent (single arrow, adapted from Asghari et al., 2009, copyright permission to reproduce the figure). SR degradation during heart failure (Pinali et al., 2013) is suggested to be linked to reduction in SERCA levels, based on observations in the conditional SERCA knockout mouse (D, control cardiomyocyte; E, following SERCA knockout, with SR pseudo-colored; adapted from Swift et al., 2012, copyright permission was not required to reproduce the figure).
FIGURE 5
FIGURE 5
Super-resolution imaging of RyR clusters and plasticity. (A) RyRs on the cell surface of ventricular cardiomyocytes form clusters primarily along either side of the z-lines (double rows of RyRs). The limited resolution of conventional confocal imaging (shown red) is markedly improved using the dSTORM technique (green), which reveals the range of size and morphologies of RyR clusters. dSTORM also allows the visualization of smaller clusters and single RyRs (arrows, from Baddeley et al., 2009, copyright permission was not required to reproduce the figure). (B) Neighboring clusters can form superclusters or Ca2+ release units (CRUs) (dotted line; upper panel). DNA-PAINT reveals that RyRs within clusters are found in various orientations and groupings (lower panel, from Jayasinghe et al., 2018, copyright permission to reproduce the figure). (C,D) During heart failure, RyR clusters are broken apart, resulting in dispersed CRUs (from Kolstad et al., 2018, copyright permission was not required to reproduce the figure). (E,F) In contrast, RyR cluster size is increased in response to JPH2 overexpression (from Munro et al., 2016, copyright permission to reproduce the figure).
FIGURE 6
FIGURE 6
RyR cluster conformations. (A) Skeletal muscle RyRs (RyR1) form a regular crystalline array with 4 four LTCCs (filled circles) apposing alternate RyRs (open circles) to form tetrads. (B) Cardiac muscle RyRs (RyR2) interact in several conformations including crystalline array (blue dotted box), side-by-side (red dotted box), and disordered arrangements (black dotted box). Different stimuli modify the predominant conformation; phosphorylation promotes a crystalline array which may enhance the apposition of LTCCs and RyRs (C). Pathological conditions are reported to promote RyR cluster dispersion (Louch et al., 2013; Macquaide et al., 2015; Kolstad et al., 2018) and mislocalize t-tubules, thus, decreasing the coupling between LTCCs and RyRs (D).

References

    1. Arora R., Aistrup G. L., Supple S., Frank C., Singh J., Tai S., et al. (2017). Regional distribution of T-tubule density in left and right atria in dogs. Heart Rhythm 14 273–281. 10.1016/j.hrthm.2016.09.022 - DOI - PMC - PubMed
    1. Asghari P., Schulson M., Scriven D. R., Martens G., Moore E. D. (2009). Axial tubules of rat ventricular myocytes form multiple junctions with the sarcoplasmic reticulum. Biophys. J. 96 4651–4660. 10.1016/j.bpj.2009.02.058 - DOI - PMC - PubMed
    1. Asghari P., Scriven D. R., Sanatani S., Gandhi S. K., Campbell A. I., Moore E. D. (2014). Nonuniform and variable arrangements of ryanodine receptors within mammalian ventricular couplons. Circ. Res. 115 252–262. 10.1161/CIRCRESAHA.115.303897 - DOI - PubMed
    1. Asghari P., Scriven D. R., Zhao Y., Mondragon R. R., Valdivia H., Wehrens X. H., et al. (2017). RyR2 tetramer distributions in ventricular myocytes from phosphomutant mice. Biophys. J. 112:161a 10.1016/j.bpj.2016.11.886 - DOI
    1. Baddeley D., Jayasinghe I. D., Lam L., Rossberger S., Cannell M. B., Soeller C. (2009). Optical single-channel resolution imaging of the ryanodine receptor distribution in rat cardiac myocytes. Proc. Natl. Acad. Sci. U.S.A. 106 22275–22280. 10.1073/pnas.0908971106 - DOI - PMC - PubMed