. 2018 Dec 11:9:1789.
doi: 10.3389/fphys.2018.01789. eCollection 2018.

Locomotion as a Powerful Model to Study Integrative Physiology: Efficiency, Economy, and Power Relationship

Affiliations

Locomotion as a Powerful Model to Study Integrative Physiology: Efficiency, Economy, and Power Relationship

Leonardo Alexandre Peyré-Tartaruga et al. Front Physiol. .

Abstract

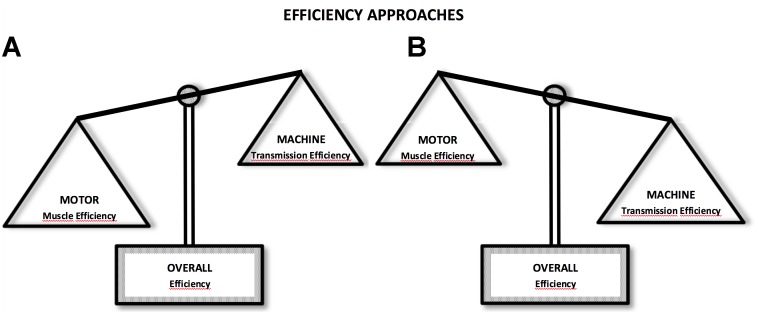
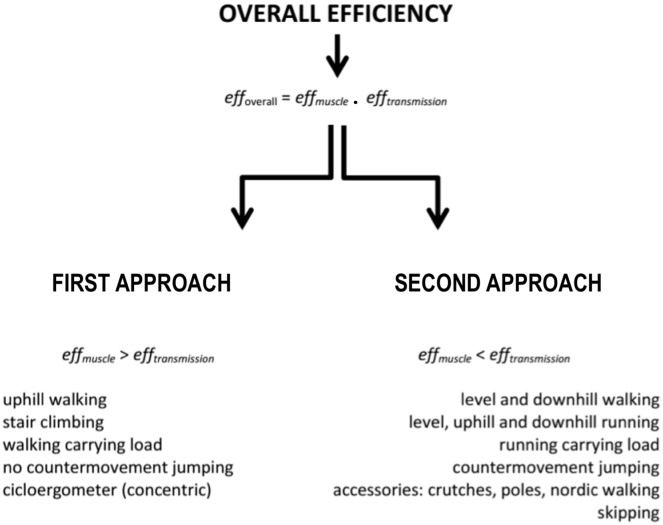
Locomotion is the most common form of movement in nature. Its study allows analysis of interactions between muscle functions (motor) and lever system arrangements (transmission), thereby facilitating performance analysis of various body organs and systems. Thus, it is a powerful model to study various aspects of integrative physiology. The results of this model can be applied in understanding body functions and design principles as performance outputs of interest for medical and biological sciences. The overall efficiency (effoverall ) during locomotion is an example of an integrative parameter, which results from the ratio between mechanical output and metabolic input. Although the concepts of cost (i.e., metabolic expenditure relative to distance) and power (i.e., metabolic expenditure relative to time) are included in its calculation, the effoverall establishes peculiar relations with these variables. For a better approach to these aspects, in this study, we presented the physical-mathematical formulation of efficiency, as well as its conceptual definitions and applications. Furthermore, the concepts of efficiency, cost, and power are discussed from the biological and medical perspectives. Terrestrial locomotion is a powerful model to study integrative physiology in humans, because by analyzing the mechanical and metabolic determinants, we may verify the efficiency and economy relationship through locomotion type, and its characteristics and restrictions. Thus, it is possible to elaborate further on various improved intervention strategies, such as physical training, competition strategies, and ergogenic supplementation.

Keywords: economy; efficiency; gait; mechanical work; metabolic cost; optimal walking speed; self-selected walking speed.


Figures

FIGURE 1
FIGURE 1
Efficiency approaches: in the first (A), muscle efficiency (motor) characteristics are more predominant during locomotor activity, influencing efficiency (overall) responses; in the second (B), transmission efficiency (machine) characteristics are predominant. In these cases, overall efficiency response may be higher and with different behavior than muscle efficiency. Lower values can be seen during situations under effect of isometric contractions and muscle coactivation.
FIGURE 2
FIGURE 2
Metabolic energy cost and overall efficiency during stair climbing test at different velocities. Data and figure adapted from Lupton and Hill (1923).
FIGURE 3
FIGURE 3
Metabolic energy cost and overall efficiency during cycling ergometer test at different velocities (revolutions per minute, RPM). (A) overall efficiency-economy behavior similar at muscle efficiency-economy relationship (in this case, Wtot increases because of increased Wint, while Wext is similar); (B) comparing energy cost and overall efficiency between different modes of work calculation: black lines are the same of (A); red lines refers to a modification at work (Wint, Wext and Wtot) in relation to the black lines. Wint corresponding cycle ergometer velocity and Wext cycle ergometer load. Data adapted from Tokui and Hirakoba (2007).
FIGURE 4
FIGURE 4
Overall efficiency during jumping in countermovement and no countermovement jumps across different mechanical power values. Data adapted from Asmussen and Bonde-Petersen (1974).
FIGURE 5
FIGURE 5
Mechanical cost (total, internal and external), metabolic cost and overall efficiency during walking and running at different velocities. Red thick line represents optimal walking speed (OWS) and transition walking-running speed (WRS) for left side (walking) and right side (running). Red dashed line represent maximal efficiency speed for walking. The letter A represents the walking speeds below OWS, the letter B represents the walking speeds between OWS and WRS, and the letter C represents walking speeds above the WRS. See further explanation for letters on text. Adapted from Cavagna and Kaneko (1977). Wext – external mechanical work; Wint – internal mechanical work; Wot – total mechanical work; En Exp – metabolic cost.
FIGURE 6
FIGURE 6
Idealization of metabolic cost (Cmetab) of walking based on adaptation of hydraulic model by Margaria (1976) with a watermill, representing the diameter of tube (aerobic Pmetab, PmetabB) releasing energy/liquid (aerobic capacity tending to infinity – A) on the blades of a watermill (energy transduction between potential and kinetic energy – C). The water remaining on the blades returns to the reservoir (energy minimization) and the water that falls into the funnel represents Cmetab (D). Internally, the blades have two compartments (one side leaked and one not) and remain all the time facing up except for the moment when they pass through the reservoir. This model represents what might be expected into the relationship between Pmetab and Cmetab at progressive walking speeds under the action of an energy minimizing mechanism, that is, how the increase in power is related to the cost. The optimal walking speed (OWS) represents the velocity in which the Cmetab is lower.
FIGURE 7
FIGURE 7
Locomotion modes and constraints organized according to the approach between efficiency (eff) and economy relationship. Note: effoverall – overall efficiency; effmuscle – muscle efficiency; efftransmission – transmission efficiency.
FIGURE 8
FIGURE 8
Metabolic cost at different speeds and two possible training effects for a person with locomotor disabilities. At both situations LRI increased. A: only increased of SSWS; B: increased of SSWS and decreased of metabolic cost. SSWS, self-selected walking speed; OWS, optimal walking speed; LRI, locomotor rehabilitation index.

Similar articles

Cited by

References

    1. Abbott B., Bigland B., Ritchie J. (1952). The physiological cost of negative work. J. Physiol. 117 380–390. 10.1113/jphysiol.1952.sp004755 - DOI - PMC - PubMed
    1. Alexander R. (1989). Optimization and gaits in the locomotion of vertebrates. Physiol. Rev. 69 1199–1227. 10.1152/physrev.1989.69.4.1199 - DOI - PubMed
    1. Alexander R. (2004). Bipedal animals, and their differences from humans. J. Anat. 204 321–330. 10.1111/j.0021-8782.2004.00289.x - DOI - PMC - PubMed
    1. Amara C. E., Shankland E. G., Jubrias S. A., Marcinek D. J., Kushmerick M. J., Conley K. E. (2007). Mild mitochondrial uncoupling impacts cellular aging in human muscles in vivo. Proc. Natl. Acad. Sci. U.S.A. 104 1057–1062. 10.1073/pnas.0610131104 - DOI - PMC - PubMed
    1. Ardigò L., Saibene F., Minetti A. E. (2003). The optimal locomotion on gradients: walking, running or cycling? Eur. J. Appl. Physiol. 90 365–371. 10.1007/s00421-003-0882-7 - DOI - PubMed

LinkOut - more resources