. 2018 Dec 4:9:2766.
doi: 10.3389/fmicb.2018.02766. eCollection 2018.

Microglia Increase Inflammatory Responses in iPSC-Derived Human BrainSpheres

Affiliations

Microglia Increase Inflammatory Responses in iPSC-Derived Human BrainSpheres

Celina Monteiro Abreu et al. Front Microbiol. .

Abstract

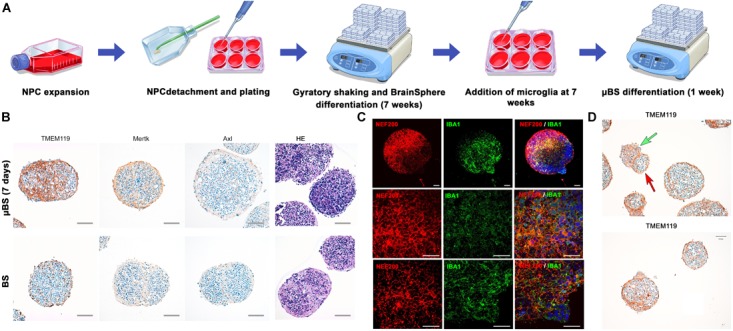
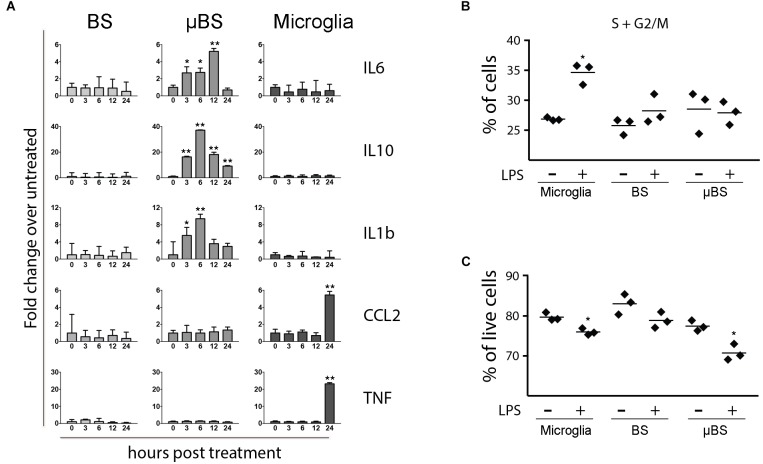
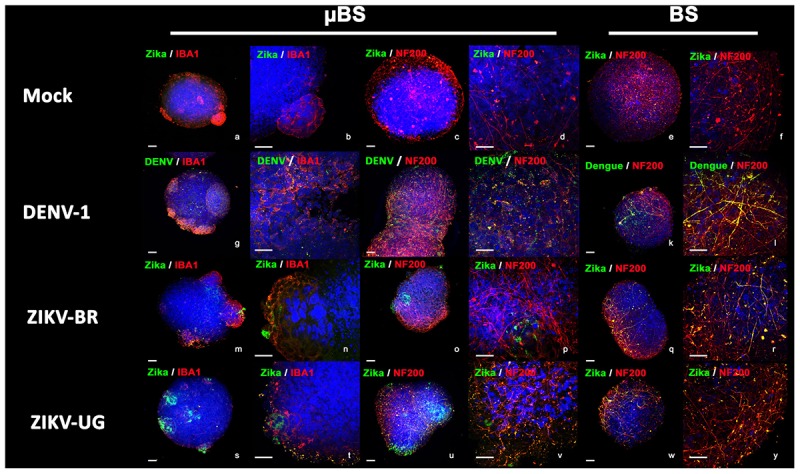
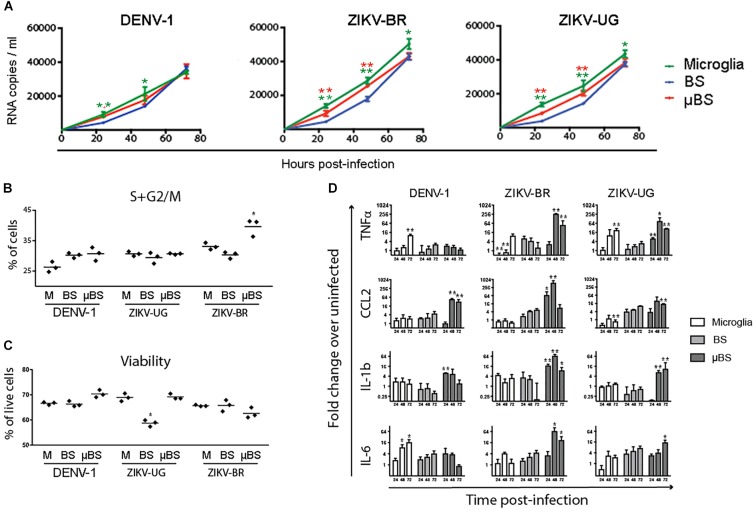
Human induced pluripotent stem cells (iPSCs), together with 21st century cell culture methods, have the potential to better model human physiology with applications in toxicology, disease modeling, and the study of host-pathogen interactions. Several models of the human brain have been developed recently, demonstrating cell-cell interactions of multiple cell types with physiologically relevant 3D structures. Most current models, however, lack the ability to represent the inflammatory response in the brain because they do not include a microglial cell population. Microglia, the resident immunocompetent phagocytes in the central nervous system (CNS), are not only important in the inflammatory response and pathogenesis; they also function in normal brain development, strengthen neuronal connections through synaptic pruning, and are involved in oligodendrocyte and neuronal survival. Here, we have successfully introduced a population of human microglia into 3D human iPSC-derived brain spheres (BrainSpheres, BS) through co-culturing cells of the Immortalized Human Microglia - SV40 cell line with the BS model (μBS). We detected an inflammatory response to lipopolysaccharides (LPS) and flavivirus infection, which was only elicited in the model when microglial cells were present. A concentration of 20 ng/mL of LPS increased gene expression of the inflammatory cytokines interleukin-6 (IL-6), IL-10, and IL-1β, with maximum expression at 6-12 h post-exposure. Increased expression of the IL-6, IL-1β, tumor necrosis factor alpha (TNF-α), and chemokine (C-C motif) ligand 2 (CCL2) genes was observed in μBS following infection with Zika and Dengue Virus, suggesting a stronger inflammatory response in the model when microglia were present than when only astrocyte, oligodendrocyte, and neuronal populations were represented. Microglia innately develop within cerebral organoids (Nature communications), our findings suggest that the μBS model is more physiologically relevant and has potential applications in infectious disease and host-pathogen interactions research.

Keywords: BrainSpheres; in vitro culture; microglial cells; organoids; zika virus.


Figures

FIGURE 1
FIGURE 1
Generation of microglia-containing BS (μBS). Immortalized Human Microglia – SV40 were incorporated to 7 week-differentiated BS by gravity as described in materials and methods. (A) Diagram of μBS generation procedure. (B) Comparison between μBS and BS using different microglia markers (TMEM119, Mertk, Axl) and hematoxylin/eosin (HE). (C) Confocal images of immunohistochemistry for the microglia marker IBA1 (green), the neuronal marker NF200 (red), and nuclear staining (Hoechst 33342, blue) in μBS, 48 h after microglia incorporation. (D) Details of microglia aggregations in μBS. Green arrow indicates microglia cluster and red arrow indicates the BS. Bars represent 100 μm (B), 50 μm (C, upper panel), 20 μm (C, all other panels), and 50 μm (D).
FIGURE 2
FIGURE 2
Differences between BS, μBS, and microglia after LPS treatment. The microglia, BS, μBS, were exposed to 20 ng/mL LPS up to 24 h. (A) shows gene expression of IL6, IL10, IL1b, CCL2, and TNFa after LPS treatment on the different models (BS, μBS, and microglia cells). Data are shown as fold change of treated versus untreated up to an hour post treatment (3, 6, 12, and 24 h after treatment). (B) show changes in cell cycle in percentage of the cells in G2 plus S phase in microglia cells, BS and μBS treated or non-treated with LPS. Each dot symbol represent a replicate sample (n+3). (C) shows Annexin V Apoptosis Muse assay. Results show % live cells microglia, BS, ad μBS cells treated (+) or not treated (–) with LPS. Each symbol represent a replicate (n = 3). Statistical analysis in A was performed using Dunnett test on ΔΔCt. The asterisks symbols represents P < 0.05 and ∗∗P < 0.01 (two independent experiments and three biological replicates on each experiment).
FIGURE 3
FIGURE 3
Virus infection in BrainSpheres. Figure shows virus infection by immunohistochemistry in BrainSpheres with (μBS) and without microglia (BS). Green represents the Flavivirus marker for ZIKV (NS1) and DENV-1, red represents microglia markers IBA1 and NF200. Bars represent 50 μm (lower magnification) and 10 μm (higher magnification).
FIGURE 4
FIGURE 4
Effects of Flavivirus infection on 3D human iPSC-derived brain spheres (BrainSpheres, BS) without or with microglia cells (μBS). The microglia cells, BS, and μBS were infected with Dengue, ZIKV-BR, and ZIKV-UG using MOI equal 0.1. (A) shows the growth kinetics of flaviviruses over time for the three models. The viral load (RNA copies/mL) are shown with standard deviation. (B) Changes in cell cycle shown as percentage of cells in G2/S phase in BS, μBS, and microglia treated or non-treated with the different viruses. (C) Annexin V Apoptosis Muse assay results. Results represent % live cells in BS, μBS, and microglia samples after the different flavivirus treatments. (D) Gene expression relative quantification for TNFα, CCL2, IL-1b, and IL-6 over the time. Statistical analysis was performed using the Dunnett’s Test (mean equal p < 0.05 and ∗∗p < 0.01) for two independent experiments, three biological replicates on each experiment.

Similar articles

Cited by

References

    1. Alliot F., Godin I., Pessac B. (1999). Microglia derive from progenitors, originating from the yolk sac, and which proliferate in the brain. Brain Res. Dev. Brain Res. 117 145–152. 10.1016/S0165-3806(99)00113-3 - DOI - PubMed
    1. Arandjelovic S., Ravichandran K. S. (2015). Phagocytosis of apoptotic cells in homeostasis. Nat. Immunol. 16 907–917. 10.1038/ni.3253 - DOI - PMC - PubMed
    1. Arango Duque G., Descoteaux A. (2014). Macrophage cytokines: involvement in immunity and infectious diseases. Front. Immunol. 5:491. 10.3389/fimmu.2014.00491 - DOI - PMC - PubMed
    1. Baby N., Patnala R., Ling E. A., Dheen S. T. (2014). Nanomedicine and its application in treatment of microglia-mediated neuroinflammation. Curr. Med. Chem. 21 4215–4226. 10.2174/0929867321666140716101258 - DOI - PubMed
    1. Baer A., Kehn-Hall K. (2014). Viral concentration determination through plaque assays: using traditional and novel overlay systems. J. Vis. Exp. 93:e52065. 10.3791/52065 - DOI - PMC - PubMed

LinkOut - more resources