

Low-Abundance Members of the Firmicutes Facilitate Bioremediation of Soil Impacted by Highly Acidic Mine Drainage From the Malanjkhand Copper Project, India
- PMID: 30619102
- PMCID: PMC6297179
- DOI: 10.3389/fmicb.2018.02882
Low-Abundance Members of the Firmicutes Facilitate Bioremediation of Soil Impacted by Highly Acidic Mine Drainage From the Malanjkhand Copper Project, India
Abstract
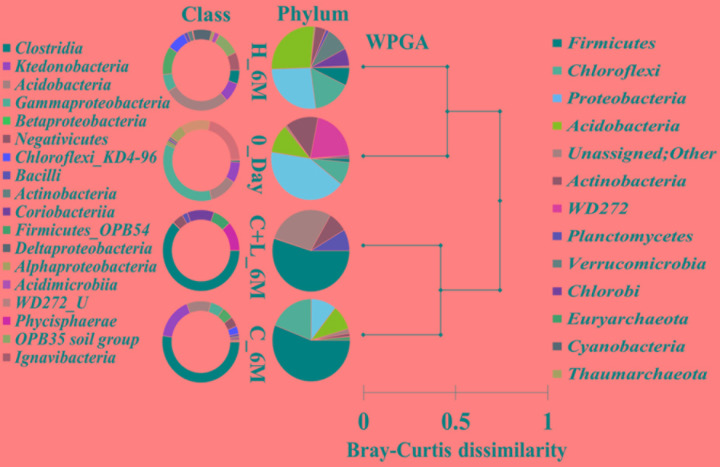
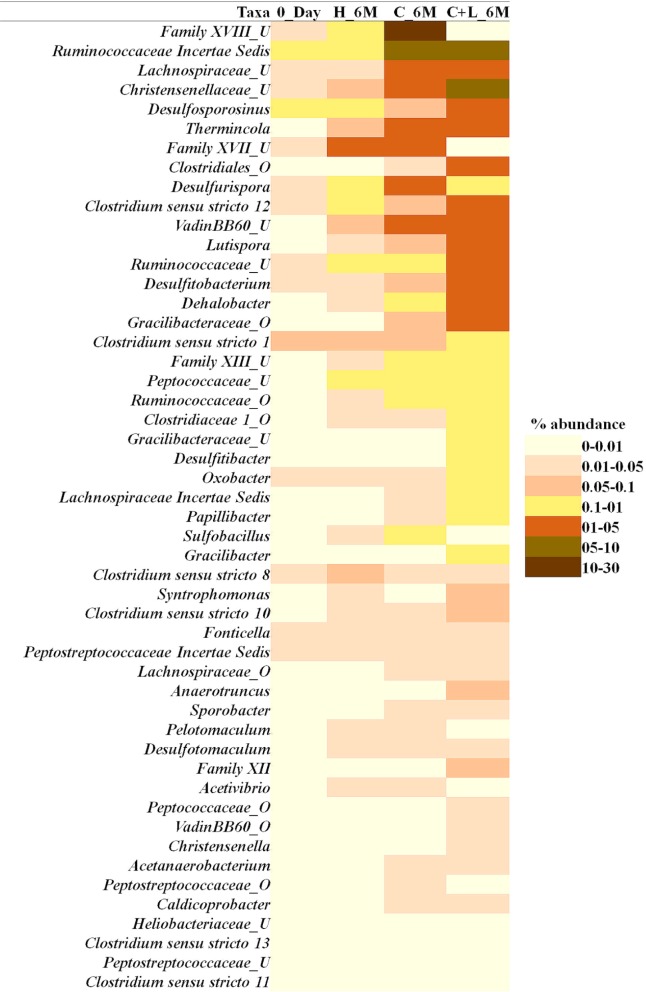
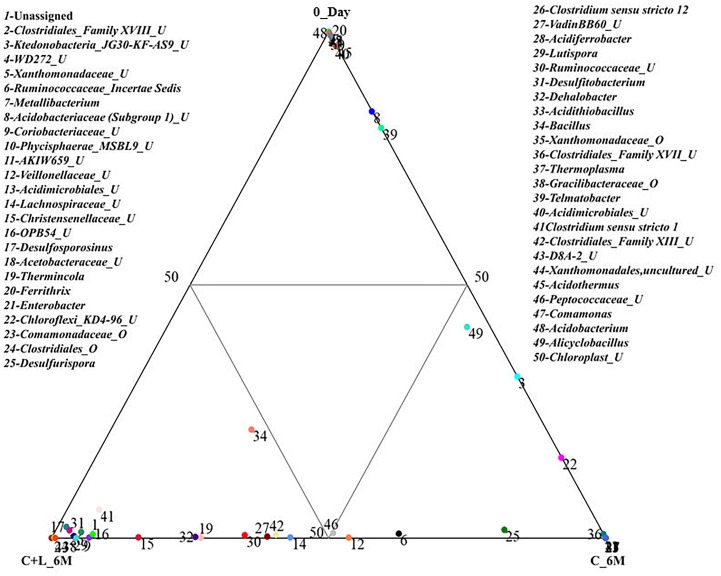
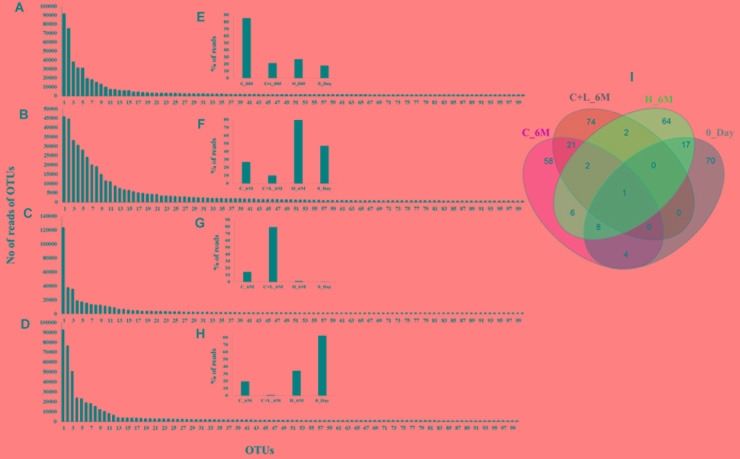
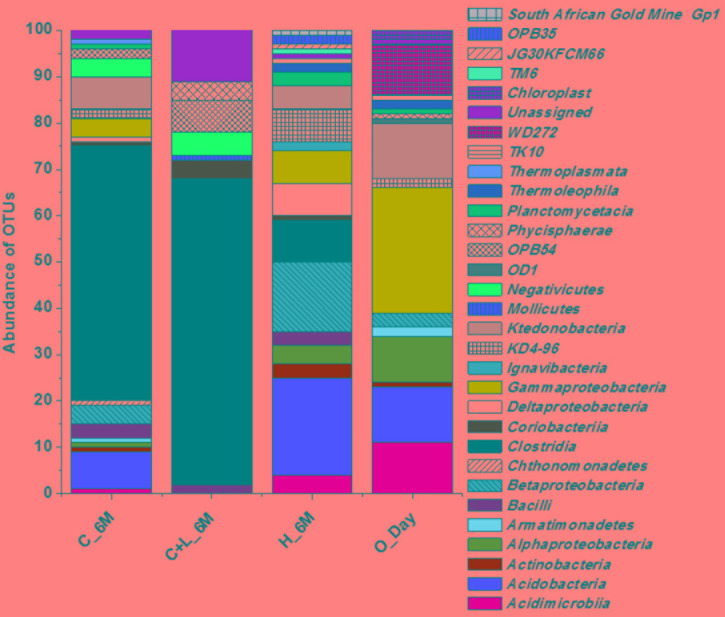
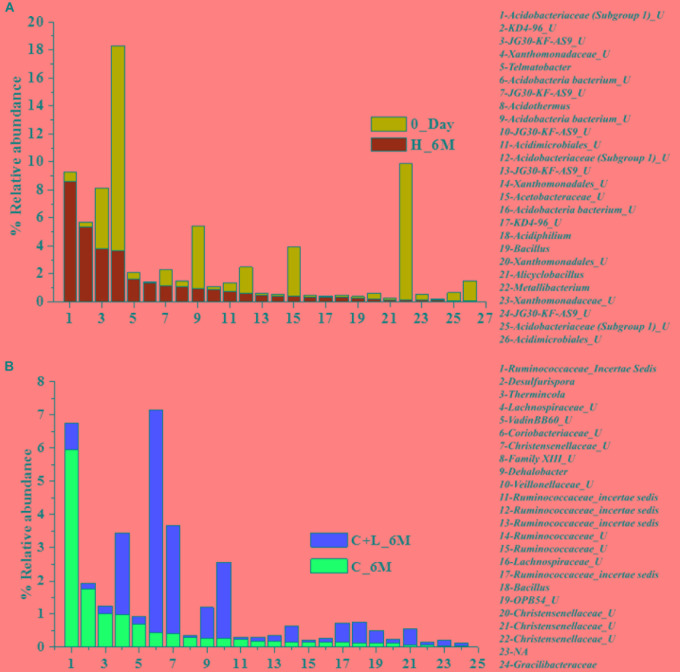
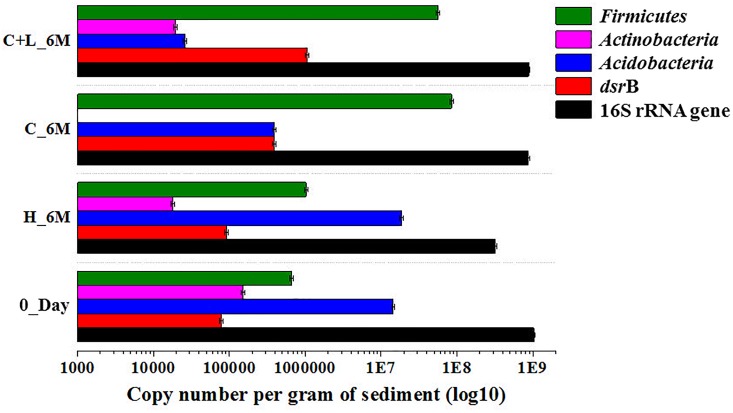
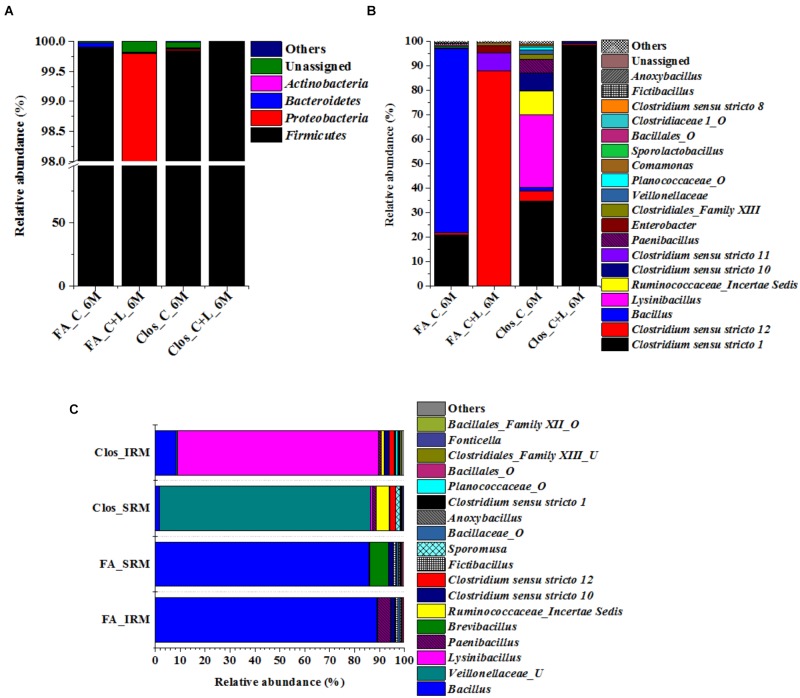
Sulfate- and iron-reducing heterotrophic bacteria represented minor proportion of the indigenous microbial community of highly acidic, oligotrophic acid mine drainage (AMD), but they can be successfully stimulated for in situ bioremediation of an AMD impacted soil (AIS). These anaerobic microorganisms although played central role in sulfate- and metal-removal, they remained inactive in the AIS due to the paucity of organic carbon and extreme acidity of the local environment. The present study investigated the scope for increasing the abundance and activity of inhabitant sulfate- and iron-reducing bacterial populations of an AIS from Malanjkhand Copper Project. An AIS of pH 3.5, high soluble SO4 2- (7838 mg/l) and Fe (179 mg/l) content was amended with nutrients (cysteine and lactate). Thorough geochemical analysis, 16S rRNA gene amplicon sequencing and qPCR highlighted the intrinsic metabolic abilities of native bacteria in AMD bioremediation. Following 180 days incubation, the nutrient amended AIS showed marked increase in pH (to 6.6) and reduction in soluble -SO4 2- (95%), -Fe (50%) and other heavy metals. Concomitant to physicochemical changes a vivid shift in microbial community composition was observed. Members of the Firmicutes present as a minor group (1.5% of total community) in AIS emerged as the single most abundant taxon (∼56%) following nutrient amendments. Organisms affiliated to Clostridiaceae, Peptococcaceae, Veillonellaceae, Christensenellaceae, Lachnospiraceae, Bacillaceae, etc. known for their fermentative, iron and sulfate reducing abilities were prevailed in the amended samples. qPCR data corroborated with this change and further revealed an increase in abundance of dissimilatory sulfite reductase gene (dsrB) and specific bacterial taxa. Involvement of these enhanced populations in reductive processes was validated by further enrichments and growth in sulfate- and iron-reducing media. Amplicon sequencing of these enrichments confirmed growth of Firmicutes members and proved their sulfate- and iron-reduction abilities. This study provided a better insight on ecological perspective of Firmicutes members within the AMD impacted sites, particularly their involvement in sulfate- and iron-reduction processes, in situ pH management and bioremediation.
Keywords: Firmicutes; acid mine drainage; bioremediation; biostimulation; dissimilatory sulfate reduction; metagenomics; quantitative PCR.
Figures
Similar articles
-
Role of cost-effective organic carbon substrates in bioremediation of acid mine drainage-impacted soil of Malanjkhand Copper Project, India: a biostimulant for autochthonous microbial populations.Environ Sci Pollut Res Int. 2020 Aug;27(22):27407-27421. doi: 10.1007/s11356-019-06293-6. Epub 2019 Sep 14. Environ Sci Pollut Res Int. 2020. PMID: 31522400
-
Characterization and application of an anaerobic, iron and sulfate reducing bacterial culture in enhanced bioremediation of acid mine drainage impacted soil.J Environ Sci Health A Tox Hazard Subst Environ Eng. 2020;55(4):464-482. doi: 10.1080/10934529.2019.1709362. Epub 2020 Jan 23. J Environ Sci Health A Tox Hazard Subst Environ Eng. 2020. PMID: 31971065
-
Glycerol amendment enhances biosulfidogenesis in acid mine drainage-affected areas: An incubation column experiment.Front Bioeng Biotechnol. 2022 Aug 29;10:978728. doi: 10.3389/fbioe.2022.978728. eCollection 2022. Front Bioeng Biotechnol. 2022. PMID: 36105607 Free PMC article.
-
A composite taxonomical and functional framework of microbiomes under acid mine drainage bioremediation systems.J Environ Manage. 2019 Dec 1;251:109581. doi: 10.1016/j.jenvman.2019.109581. Epub 2019 Sep 25. J Environ Manage. 2019. PMID: 31563048 Review.
-
Bioremediation of mine water.Adv Biochem Eng Biotechnol. 2014;141:109-72. doi: 10.1007/10_2013_265. Adv Biochem Eng Biotechnol. 2014. PMID: 24357145 Review.
Cited by
-
The Composition and Function of the Rhizosphere Bacterial Community of Paeonia lactiflora Varies with the Cultivar.Biology (Basel). 2023 Oct 24;12(11):1363. doi: 10.3390/biology12111363. Biology (Basel). 2023. PMID: 37997962 Free PMC article.
-
Humate application alters microbiota-mineral interactions and assists in pasture dieback recovery.Heliyon. 2023 Jan 31;9(2):e13327. doi: 10.1016/j.heliyon.2023.e13327. eCollection 2023 Feb. Heliyon. 2023. PMID: 36755593 Free PMC article.
-
Metagenomics and Culture Dependent Insights into the Distribution of Firmicutes across Two Different Sample Types Located in the Black Hills Region of South Dakota, USA.Microorganisms. 2021 Jan 6;9(1):113. doi: 10.3390/microorganisms9010113. Microorganisms. 2021. PMID: 33418927 Free PMC article.
-
Taxonomic response of bacterial and fungal populations to biofertilizers applied to soil or substrate in greenhouse-grown cucumber.Sci Rep. 2022 Nov 2;12(1):18522. doi: 10.1038/s41598-022-22673-4. Sci Rep. 2022. PMID: 36323754 Free PMC article.
-
Rhizosphere Diazotrophs and Other Bacteria Associated with Native and Encroaching Legumes in the Succulent Karoo Biome in South Africa.Microorganisms. 2022 Jan 20;10(2):216. doi: 10.3390/microorganisms10020216. Microorganisms. 2022. PMID: 35208671 Free PMC article.
References
-
- AlAbbas F. M., Bhola S. M., Spear J. R., Olson D. L., Mishra B. (2013). The shielding effect of wild type iron reducing bacterial flora on the corrosion of linepipe steel. Eng. Fail. Anal. 33 222–235. 10.1016/j.engfailanal.2013.05.020 - DOI
-
- Becerra C. A., López-Luna E. L., Ergas S. J., Nüsslein K. (2009). Microcosm-based study of the attenuation of an acid mine drainage-impacted site through biological sulfate and iron reduction. Geomicrobiol. J. 26 9–20. 10.1080/014904508025992 - DOI
LinkOut - more resources
Full Text Sources