

Identification of Microbial Dark Matter in Antarctic Environments
- PMID: 30619224
- PMCID: PMC6305705
- DOI: 10.3389/fmicb.2018.03165
Identification of Microbial Dark Matter in Antarctic Environments
Abstract
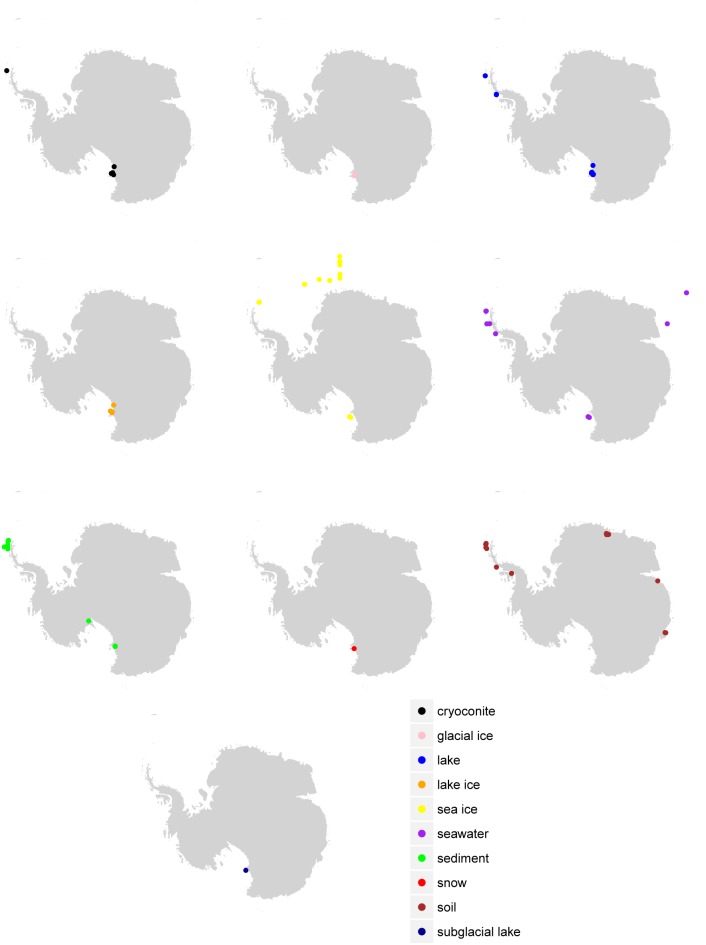
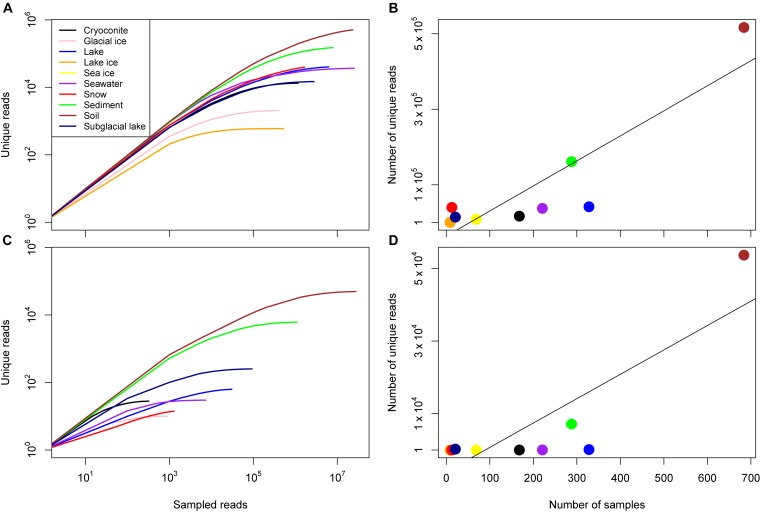
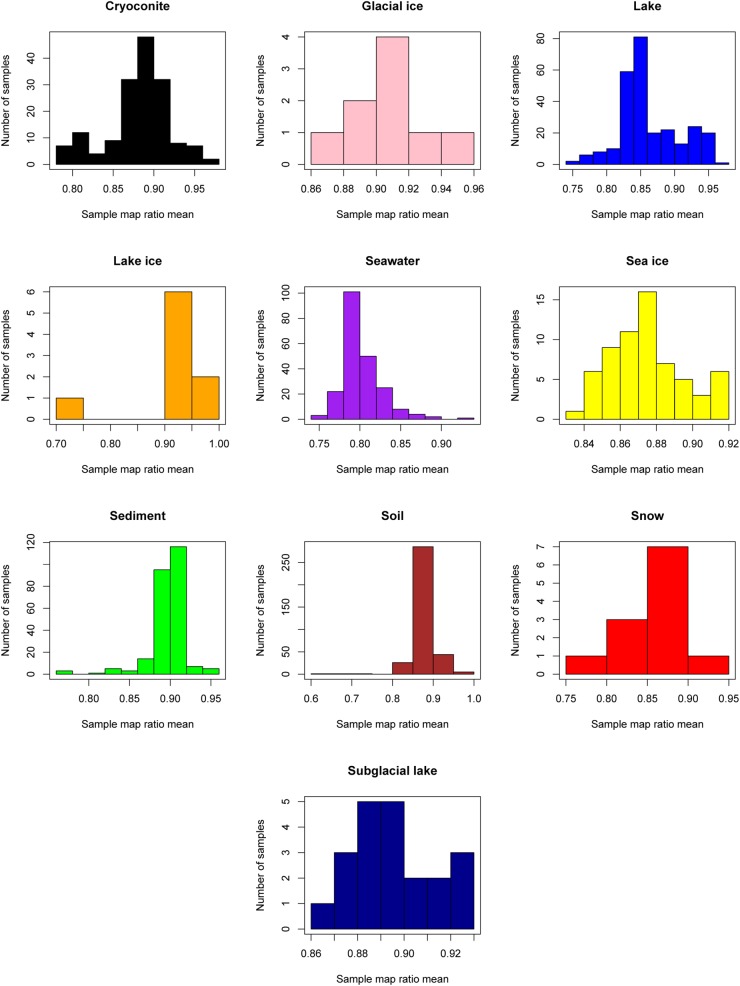
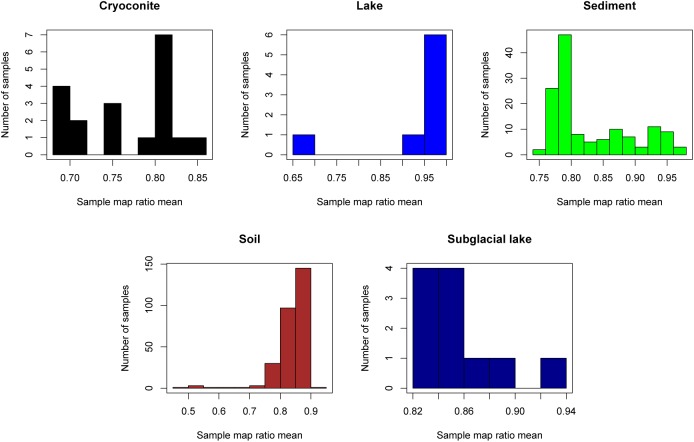
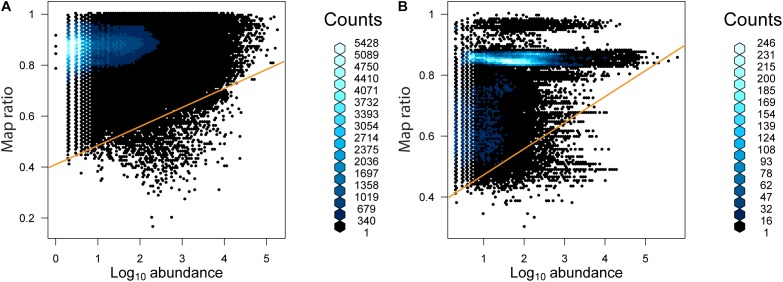
Numerous studies have applied molecular techniques to understand the diversity, evolution, and ecological function of Antarctic bacteria and archaea. One common technique is sequencing of the 16S rRNA gene, which produces a nearly quantitative profile of community membership. However, the utility of this and similar approaches is limited by what is known about the evolution, physiology, and ecology of surveyed taxa. When representative genomes are available in public databases some of this information can be gleaned from genomic studies, and automated pipelines exist to carry out this task. Here the paprica metabolic inference pipeline was used to assess how well Antarctic microbial communities are represented by the available completed genomes. The NCBI's Sequence Read Archive (SRA) was searched for Antarctic datasets that used one of the Illumina platforms to sequence the 16S rRNA gene. These data were quality controlled and denoised to identify unique reads, then analyzed with paprica to determine the degree of overlap with the closest phylogenetic neighbor with a completely sequenced genome. While some unique reads had perfect mapping to 16S rRNA genes from completed genomes, the mean percent overlap for all mapped reads was 86.6%. When samples were grouped by environment, some environments appeared more or less well represented by the available genomes. For the domain Bacteria, seawater was particularly poorly represented with a mean overlap of 80.2%, while for the domain Archaea glacial ice was particularly poorly represented with an overlap of only 48.0% for a single sample. These findings suggest that a considerable effort is needed to improve the representation of Antarctic microbes in genome sequence databases.
Keywords: 16S rRNA; Antarctica; cryoconite; glacier; permafrost; sea ice; sediment; snow.
Figures
References
-
- Amir A., McDonald D., Navas-Molina J. A., Kopylova E., Morton J. T., Zech Xu Z., et al. (2017). Deblur Rapidly Resolves Single-’, American Society for Microbiology. Available at: http://genomebiology.biomedcentral.com/articles/10.1186/gb-2012-13-9-r79 - DOI - PMC - PubMed
-
- Bendia A. G., Signori C. N., Franco D. C., Duarte R. T. D., Bohannan B. J. M., Pellizari V. H., et al. (2018). A mosaic of geothermal and marine features shapes microbial community structure on deception Island Volcano, Antarctica. Front. Microbiol. 9:899. 10.3389/fmicb.2018.00899 - DOI - PMC - PubMed
-
- Bowman J., Ducklow H. (2015). Microbial communities can be described by metabolic structure: a general framework and application to a seasonally variable, depth-stratified microbial community from the coastal West Antarctic Peninsula. PloS One 10:e0135868. 10.1371/journal.pone.0135868 - DOI - PMC - PubMed
LinkOut - more resources
Full Text Sources
Molecular Biology Databases