. 2018 Dec 11:9:2856.
doi: 10.3389/fimmu.2018.02856. eCollection 2018.

T Lymphocytes Contribute to the Control of Baseline Neural Precursor Cell Proliferation but Not the Exercise-Induced Up-Regulation of Adult Hippocampal Neurogenesis

Affiliations

T Lymphocytes Contribute to the Control of Baseline Neural Precursor Cell Proliferation but Not the Exercise-Induced Up-Regulation of Adult Hippocampal Neurogenesis

Tara L Walker et al. Front Immunol. .

Abstract

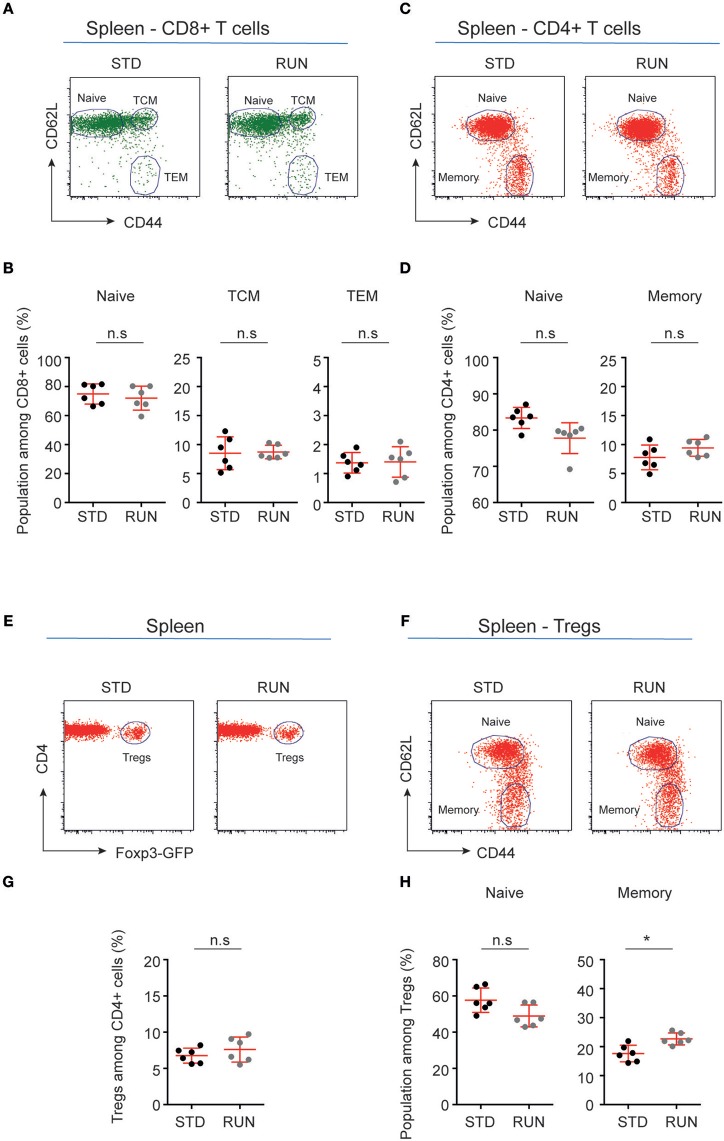
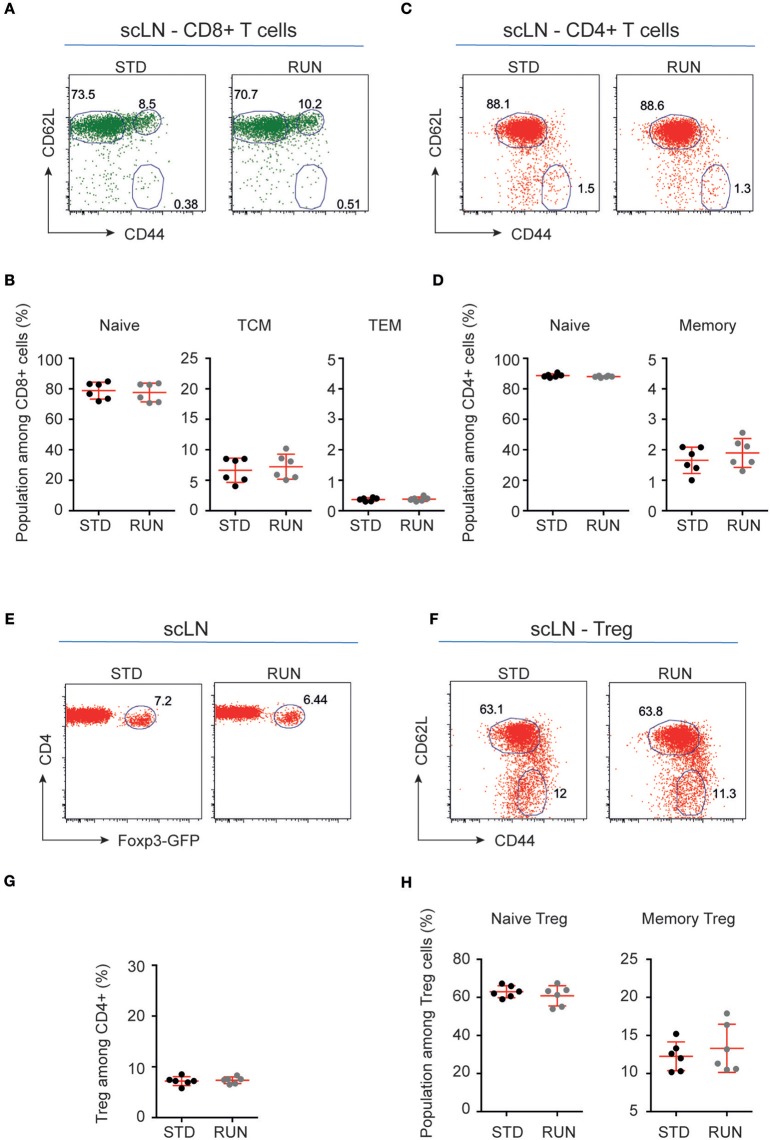
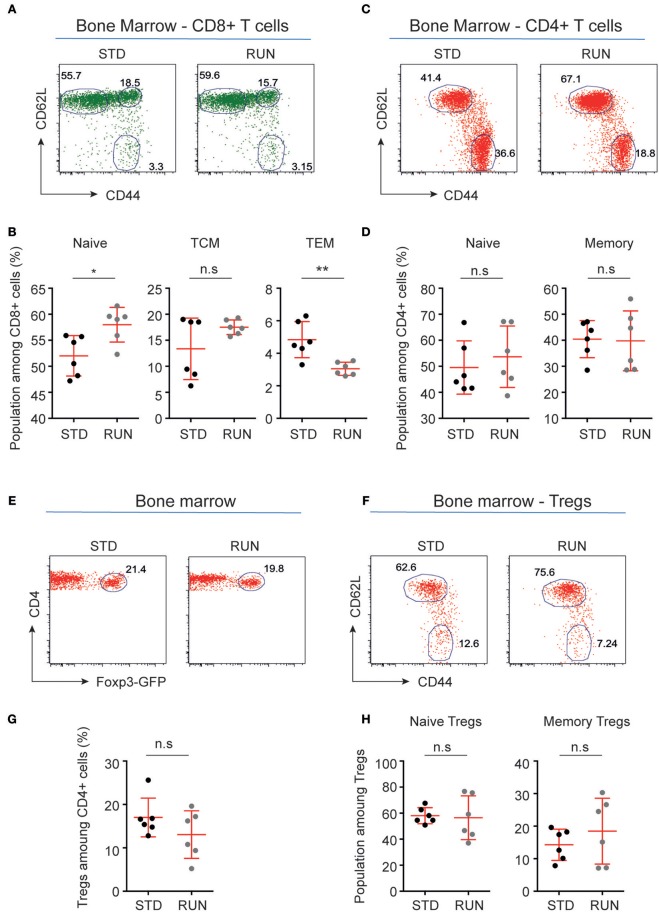
Cross-talk between the peripheral immune system and the central nervous system is important for physiological brain health. T cells are required to maintain normal baseline levels of neural precursor proliferation in the hippocampus of adult mice. We show here that neither T cells, B cells, natural killer cells nor natural killer T cells are required for the increase in hippocampal precursor proliferation that occurs in response to physical exercise. In addition, we demonstrate that a subpopulation of T cells, regulatory T cells, is not involved in maintaining baseline levels of neural precursor proliferation. Even when applied at supraphysiological numbers, populations of both naive and stimulated lymphocytes had no effect on hippocampal precursor proliferation in vitro. In addition, physical activity had no effect on peripheral immune cells in terms of distribution in the bone marrow, lymph nodes or spleen, activation state or chemokine receptor (CXCR4 and CCR9) expression. Together these results suggest that lymphocytes are not involved in translating the peripheral effects of exercise to the neurogenic niche in the hippocampus and further support the idea that the exercise-induced regulation of adult neurogenesis is mechanistically distinct from its baseline control.

Keywords: T cell; adult neurogenesis; dentate gyrus; hippocampus; neural precursor cell; physical activity; regulatory T cell.


Figures

Figure 1
Figure 1
Tregs are not required to maintain baseline levels of hippocampal neurogenesis. (A) Experimental design. (B) Representative dot plots of the frequencies of CD25+ Foxp3-GFP+ Treg cells among gated CD4+ T cells in the blood of saline- and DT- treated B6.Dereg mice. (C) Depletion of Tregs had no effect on the number of proliferating (Ki67+) precursor cells observed in the hippocampal SGZ. Data were analyzed using a one-way ANOVA with a Dunnett's post-hoc test. Symbols and horizontal lines indicate individual mice and mean values ± SEM, respectively.
Figure 2
Figure 2
Lymphocytes are not required for the exercise-induced increase in hippocampal precursor proliferation. (A) Experimental design. Following exercise, a significant increase in the number of proliferating precursor cells was observed within the DG of C57BL/6 (B), Dereg (C), TCRα−/− (D), Rag1−/− (E), and Rag2−/−γc−/− (F) mice. (G) Representative image of BrdU staining in the DG of Rag2−/−γc−/− mice. No change in baseline proliferation, or a response to physical exercise was observed in the other neurogenic niche, the SVZ, in C57BL/6 (H), TCRα−/− (I), Rag1−/− (J), and Rag2−/−−/− (K) mice. (L) Representative image of BrdU staining in the DG of Rag2−/−−/− mice. Symbols and horizontal lines indicate individual mice and mean values ± SEM, respectively. The level of significance was determined using a two-tailed Student's t-test. *p < 0.05, n.s = not significant. Scale bars in (F,K) are 50 μm.
Figure 3
Figure 3
Co-culture with T cells does not affect hippocampal neural precursor proliferation. (A) Depiction of the experimental set-up with T cells placed in trans-well inserts over primary hippocampal cells, which are cultured in the neurosphere assay. (B) No difference in neurosphere number was observed following co-culture of primary hippocampal cells with populations of T cells. (C) Co-culture with T cells had no effect on the size of the resulting neurospheres. Symbols and horizontal lines indicate individual neural stem cell preparations and mean values ± SEM, respectively. Data were analyzed using a one-way ANOVA with a Dunnett's post-hoc test.
Figure 4
Figure 4
Running does not influence lymphocyte distribution in the bone marrow or peripheral lymphoid organs. Physical exercise did not change the distribution of B cells (A), CD8+ T cells (B), CD4+ T cells (C) or Tregs (D) in the bone marrow, lymph nodes or spleen. Mesenteric lymph nodes (mLN), subcutaneous lymph nodes (scLN). Symbols and horizontal lines indicate individual mice and mean values ± SD, respectively. Data were analyzed using a two-tailed Mann Whitney test.
Figure 5
Figure 5
Maturation stages of CD8+ and CD4+ T cells and Tregs in the spleen of standard-housed and exercising mice. (A,C) Representative dot plots of CD62L and CD44 expression on CD8+ (A) and CD4+ (C) T cells in the spleen of mice that were housed under STD or RUN conditions. (B) Composite frequencies of naive, central memory (TCM), and effector memory (TEM) T cells among CD8+ T cells in the spleen. (D) Composite frequencies of naïve and memory T cells among CD4+ T cells in the spleen. (E) Representative dot plots depicting the expression of Foxp3-GFP among gated CD4+ T cells in the spleen of mice that were housed under STD or RUN conditions. (G) Composite frequencies of Foxp3+ Tregs among CD4+ T cells in the spleen. (F) Representative dot plots depicting the expression of the maturation markers CD62L and CD44 on Foxp3+ Tregs. (H) Composite percentages of naive and memory Treg cells in the spleen of STD and RUN mice after 4 days of running. Numbers in dot plots in (B,D,G,H) indicate the percentages of cells within the respective gate. Symbols and horizontal lines indicate individual mice and mean values ± SD, respectively. The level of significance was determined by a two-tailed Mann Whitney test. Data were compiled from two independent experiments. *p < 0.05.
Figure 6
Figure 6
Maturation stages of CD8+ and CD4+ T cells and Tregs in the subcutaneous lymph nodes of STD and RUN mice. (A,C) Representative dot plots of CD62L and CD44 expression on CD8+ (A) and CD4+ (C) T cells in the subcutaneous lymph nodes (scLN) of mice that were housed under STD or RUN conditions. (B) Composite frequencies of naive, central memory (TCM) and effector memory (TEM) T cells among CD8+ T cells in the scLN. (D) Composite frequencies of naive and memory T cells among CD4+ T cells in the scLN. (E) Representative dot plots depicting the expression of Foxp3-GFP among gated CD4+ T cells in the scLN of mice that were housed under STD or RUN conditions. (G) Composite frequencies of Foxp3+ Tregs among CD4+ T cells in the scLN. (F) Representative dot plots depicting the expression of the maturation markers CD62L and CD44 on Foxp3+ Tregs. (H) Composite percentages of naive and memory Tregs in the scLN of STD and RUN mice after 4 days of running. Numbers in dot plots in (B,D,G,H) indicate the percentages of cells within the respective gate. Symbols and horizontal lines indicate individual mice and mean values ± SD, respectively. The level of significance was determined by a two-tailed Mann Whitney test. Data were compiled from two independent experiments.
Figure 7
Figure 7
Maturation stages of CD8+ and CD4+ T cells and Tregs in the bone marrow of STD and RUN mice. (A,C) Representative dot plots of CD62L and CD44 expression on CD8+ (A) and CD4+ (C) T cells in the bone marrow of mice that were housed under STD or RUN conditions. (B) Composite frequencies of naive, central memory (TCM), and effector memory (TEM) T cells among CD8+ T cells in the bone marrow. (D) Composite frequencies of naive and memory T cells among CD4+ T cells in the bone marrow. (E) Representative dot plots depicting the expression of Foxp3-GFP among gated CD4+ T cells in the bone marrow of mice that were housed under STD or RUN conditions. (G) Composite frequencies of Foxp3+ Tregs among CD4+ T cells in the bone marrow. (F) Representative dot plots depicting the expression of the maturation markers CD62L and CD44 on Foxp3+ Tregs. (H) Composite percentages of naive and memory Tregs in the bone marrow of STD and RUN mice after 4 days of running. Numbers in dot plots in (B,D,G,H) indicate the percentages of cells within the respective gate. Symbols and horizontal lines indicate individual mice and mean values ± SD, respectively. The level of significance was determined by a two-tailed Mann Whitney test. Data were compiled from two independent experiments. *p < 0.05, **p < 0.01.
Figure 8
Figure 8
Expression of selected chemokine receptors on B cells, CD4+ T cells and Tregs in the bone marrow and spleen of STD and RUN mice. Composite percentages of (A) CCR9 and (B) CXCR4 expression on the indicated cell population in the bone marrow. Composite percentages of (C) CCR9 and (D) CXCR4 expression on the indicated cell populations in the spleen. Symbols and horizontal lines indicate individual mice and mean values, respectively. Data are representative of two independent experiments. Data were analyzed using a two-tailed Mann Whitney test.

References

    1. Erickson MA, Banks WA. Neuroimmune axes of the blood-brain barriers and blood-brain interfaces: bases for physiological regulation, disease states, and pharmacological interventions. Pharmacol Rev. (2018) 70:278–314. 10.1124/pr.117.014647 - DOI - PMC - PubMed
    1. Ziv Y, Ron N, Butovsky O, Landa G, Sudai E, Greenberg N, et al. . Immune cells contribute to the maintenance of neurogenesis and spatial learning abilities in adulthood. Nat Neurosci. (2006) 9:268–75. 10.1038/nn1629 - DOI - PubMed
    1. Wolf SA, Steiner B, Akpinarli A, Kammertoens T, Nassenstein C, Braun A, et al. . CD4-positive T lymphocytes provide a neuroimmunological link in the control of adult hippocampal neurogenesis. J Immunol. (2009a) 182:3979–84. 10.4049/jimmunol.0801218 - DOI - PubMed
    1. Wolf SA, Steiner B, Wengner A, Lipp M, Kammertoens T, Kempermann G. Adaptive peripheral immune response increases proliferation of neural precursor cells in the adult hippocampus. FASEB J. (2009b) 23:3121–8. 10.1096/fj.08-113944 - DOI - PubMed
    1. Huang GJ, Smith AL, Gray DH, Cosgrove C, Singer BH, Edwards A, et al. . A genetic and functional relationship between T cells and cellular proliferation in the adult hippocampus. PLoS Biol. (2010) 8:e1000561. 10.1371/journal.pbio.1000561 - DOI - PMC - PubMed

Publication types

MeSH terms

LinkOut - more resources