. 2018 Dec 14:9:2925.
doi: 10.3389/fimmu.2018.02925. eCollection 2018.

Spatial Mapping of Myeloid Cells and Macrophages by Multiplexed Tissue Staining

Affiliations

Spatial Mapping of Myeloid Cells and Macrophages by Multiplexed Tissue Staining

Joshua Saylor et al. Front Immunol. .

Abstract

An array of phenotypically diverse myeloid cells and macrophages (MC&M) resides in the tumor microenvironment, requiring multiplexed detection systems for visualization. Here we report an automated, multiplexed staining approach, named PLEXODY, that consists of five MC&M-related fluorescently-tagged antibodies (anti - CD68, - CD163, - CD206, - CD11b, and - CD11c), and three chromogenic antibodies, reactive with high- and low-molecular weight cytokeratins and CD3, highlighting tumor regions, benign glands and T cells. The staining prototype and image analysis methods which include a pixel/area-based quantification were developed using tissues from inflamed colon and tonsil and revealed a unique tissue-specific composition of 14 MC&M-associated pixel classes. As a proof-of-principle, PLEXODY was applied to three cases of pancreatic, prostate and renal cancers. Across digital images from these cancer types we observed 10 MC&M-associated pixel classes at frequencies greater than 3%. Cases revealed higher frequencies of single positive compared to multi-color pixels and a high abundance of CD68+/CD163+ and CD68+/CD163+/CD206+ pixels. Significantly more CD68+ and CD163+ vs. CD11b+ and CD11c+ pixels were in direct contact with tumor cells and T cells. While the greatest percentage (~70%) of CD68+ and CD163+ pixels was 0-20 microns away from tumor and T cell borders, CD11b+ and CD11c+ pixels were detected up to 240 microns away from tumor/T cell masks. Together, these data demonstrate significant differences in densities and spatial organization of MC&M-associated pixel classes, but surprising similarities between the three cancer types.

Keywords: FFPE; immunofluorescence; immunohistochemistry; macrophage; multiplex; myeloid; spatial profiling.


Figures
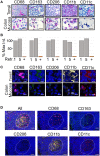
Figure 1
Figure 1
Development of the PLEXODY multiplex tissue staining assay. (A) Antibody staining patterns using chromogenic IHC detection. Panels depict select regions in tonsil (upper row) or inflamed colon mucosa (lower row) stained with the antibody listed above each panel. Slides were counterstained using hematoxylin. Scale bar = 20 μm. (B) Sensitivity of antibodies to antigen retrieval and heat denaturation. Antibody binding was measured by chromogenic signal intensity in tissues subjected to one or five rounds of antigen retrieval treatments. The signal intensity in the histogram after one retrieval was considered 100%. P-values are shown in Supplementary Table 1. In addition, each antibody was removed by heat denaturation and the slide was tested for residual antibody binding using the secondary antibody with a red chromogen. The percentage of signal remaining after antibody removal is shown as a bar labeled (+). (C) Antibody staining patterns using mIF. Panels depict a region in tonsil or inflamed colon mucosa. Slides were counterstained using DAPI. Scale bar = 10 μm. (D) Antibody staining patterns in tonsil. The region of tonsil includes a germinal center (white outline) and perifollicular zone surrounding the germinal center. Scale bar = 200 μm.
Figure 2
Figure 2
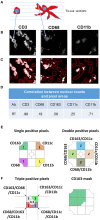
Comparison of nuclear and pixel-based segmentation methods. (A) Schematic image of a lymphocyte (left) and macrophage (right). The dashed lines represent virtual tissue sections. (B) Gray scale images of antibodies indicated above each panel. (C) Nuclear segmentation. Nuclei are outlined in the DAPI DAPI channel. The inner line demarcates the nucleus and the outer line shows the border of the doughnut used to quantify pixels for nuclear classification. To count positive pixels, the gray scale image was converted to a binary mask and thresholded. (D) Correlation between nuclear and pixel/area-based measurements. MC&M counts obtained through nuclear segmentation were correlated with MC&M-associated pixel areas obtained by the pixel-based segmentation. Pearson correlation coefficients (R2) are shown in the table. (E) Schematic representation of single, double and triple positive pixel classes. The single positive pixel group reacts with only one of the antibodies and consists of pixels stained with only on color. Pixels in double positive pixel groups, of which 10 classes can be identified, contain two colors. These pixels are identified by intersecting pixel masks from two antibodies and extracting those pixels with 2 colors. Triple positive pixels are obtained by the same process through intersection of binary pixel masks from three antibodies. (F) Pixel mask of one antibody. Example showing the CD163-mask. Pixels in this mask can be one, two, three, or more colors.
Figure 3
Figure 3
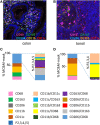
MC&M-associated pixels in inflamed colon mucosa and tonsillar germinal centers. (A,C) Colon mucosa. (A) Representative image tile of mIF 5-plex. C. Frequencies of single and double positive MC&M-associated pixel classes. The MC&M-mask, determined by the intersection of CD68+, CD163+, CD206+, CD11b+, and CD11c+ pixels, was used as the reference. Single positive and multicolor (P2, 3, 4, 5) pixel numbers were extracted from 28 tiles and the percentages of MC&M mask are shown in the left stacked bar. Standard deviations are in Supplementary Table 2. The P2, 3, 4, 5 pixel classes are further separated into ten two-color MC&M classes and their percentages are shown in the right stacked bar. (B,D) Germinal center of tonsil. (B) Representative image tile of mIF 5-plex. (D) Frequencies of single and double positive MC&M-associated pixel classes. The MC&M-mask, determined by the intersection of CD68+, CD163+, CD11b+, and CD11c+ pixels, was used as the reference. CD206+ pixels were not observed. Single positive and multicolor, P2, 3, 4 pixel numbers were extracted from eight tiles and their percentages of the MC&M-mask are shown in the left stacked bar. Standard deviations are in Supplementary Table 3. The P2, 3, 4 pixels were further separated into six two-color MC&M-associated pixel classes and their percentages are shown in the right stacked bar.
Figure 4
Figure 4
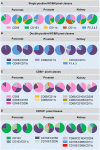
MC&M-associated pixel classes in cancers from pancreas, prostate and kidney. MC&M-associated pixel classes at a frequency of >3% are shown for three cancer types (pancreatic ductal adenocarcinoma, prostate adenocarcinoma, and clear cell renal cell carcinoma). (A) Single positive MC&M-associated pixel classes. Pie charts show single color CD68+, CD163+, CD11b+ and CD11c+ pixels as a fraction of the MC&M-mask for each cancer case. The P2,3,4,5 fraction includes all pixels colored by more than one antibody. (B) Double positive MC&M-associated pixel classes. Pie charts show double positive pixel classes within the P2, 3, 4, 5 pixel group for each cancer. In addition, the P3, 4, 5 fraction, which are pixels colored by more than two antibodies are shown. (C) Pixel classes within the CD68-mask. Single, double and triple positive pixels are shown as a fraction of all CD68+ pixels (CD68-mask). (D) Pixel classes within the CD163-mask. Single, double and triple positive pixels are shown as a fraction of the CD163+ pixels (CD163-mask). Values in pie-charts, standard deviations and number of tiles analyzed per case are in Supplementary Tables 4–7.
Figure 5
Figure 5
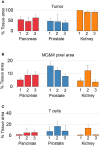
Multiplex antibody staining with sequential IF and IHC (PLEXODY assay). Fluorescent and chromogenic masks from each tile are integrated into a single dataset. (A) Percentage of tissue area occupied by cancer, and positive for cytokeratins 8/18. Standard deviations are indicated by the line above each bar. In prostate cancer cases, tumor and normal glands were separated based on mIHC with E34β12, an antibody binding to high-molecular weight cytokeratins in basal cell of normal glands. Corresponding representative digital images of mIF and mIHC in Supplementary Figures 4–12. Values and tile numbers in Supplementary Table 8. (B) Percentage of tissue area encompassed by MC&M-mask stained by mIF. (C) Percentage of tissue area positive for CD3.
Figure 6
Figure 6
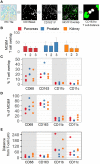
Spatial mapping of MC&M-associated pixel classes. (A) Workflow diagram of overlay between chromogenic cancer mask and fluorescent CD163-mask. (B) Density of MC&M mask in tumor area. For each cancer case, labeled 1, 2, or 3, the MC&M-associated pixel density underneath the tumor mask is shown by the bar. N = 6–10 tiles/case. Standard deviations are shown in Supplementary Table 9. (C) Densities of MC&M-associated pixel classes in tumor area. For each MC&M-associated pixel class, positive pixels underneath the tumor mask are divided by the area of the tumor mask. N = 6–10 tiles/case. Standard deviations are shown in Supplementary Table 9. (D) Percentage of MC&M-associated pixel classes underneath the tumor mask. The percentage of CD68+, CD163+, CD11b+, and CD11c+ pixels of the MC&M-mask in tumor areas is shown (n = 6–10 tiles per cancer type). Positive pixels include single, double, triple and higher order positive pixels. Standard deviations are shown in Supplementary Table 10. (E) Tumor: stroma densities of MC&M-associated pixel classes. Ratio of MC&M-associated pixel densities in the tumor (B) and MC&M-associated pixel density in the stroma. Stromal pixels are calculated by subtracting pixels in tumor area from total pixels in tissue. Standard deviations are shown in Supplementary Table 11. The dashed line refers to an equal density of colored pixels in the tumor and stroma (F). Distance measurements. Schematic representation of distance measurements between nuclei at the tumor border and CD163+ pixel clusters. The segmentation of tumor nuclei is shown in the left panels. A representative measurement of the distance between a nucleus and the closest MC&M-associated pixel group is shown in the right panel. Histograms of tumor–MC&M-associated pixel distances in prostate (n = 25 tiles) and pancreas (n = 23 tiles) cancers. The average percentages of tumor–MC&M-associated pixel distances (y-axis) in a distance interval (x-axis) are shown with the standard deviations. Separate values for prostate and pancreatic cancer types are in Supplementary Table 12.
Figure 7
Figure 7
Spatial relationships of MC&M-associated pixel classes and CD3+ T cells. (A) Workflow diagram of overlay of CD3+ T cell mask and CD163-mask in tile labeled IHC/IF and illustration of distance measurement. (B) Densities of antibody masks in direct contact with T cells. For each cancer case, labeled 1, 2, or 3, the MC&M-associated pixel density underneath the CD3-mask is shown by the bar. N = 6–10 tiles/case. Standard deviations are shown in Supplementary Table 13. (C) Densities of MC&M-associated pixel classes in direct contact with T cells. For each MC&M-associated pixel class, positive pixels underneath the CD3 mask are divided by the area of the CD3 mask. N = 6–10 tiles/case. Standard deviations are shown in Supplementary Table 13. (D) Percentage of MC&M-associated pixel classes underneath CD3 mask. The percentage of CD68+, CD163+, CD11b+, and CD11c+ pixels of the MC&M-mask in contact with T cells is shown (n = 6–10 tiles per cancer type). For each antibody, positive pixels include single, double, triple and quadruple positive pixels. Standard deviations are shown in Supplementary Table 14. (E) Mean distances between T cells and MC&M-associated pixel classes. Distances were measured as shown in (A). The mean distance and standard deviation are shown for each case and antibody in Supplementary Table 15.

References

    1. De Vlaeminck Y, Gonzalez-Rascon A, Goyvaerts C, Breckpot K. Cancer-associated myeloid regulatory cells. Front Immunol (2016) 7:113 10.3389/fimmu.2016.00113 - DOI - PMC - PubMed
    1. Elliott LA, Doherty GA, Sheahan K, Ryan EJ. Human tumor-infiltrating myeloid cells: phenotypic and functional diversity. Front Immunol. (2017) 8:86. 10.3389/fimmu.2017.00086 - DOI - PMC - PubMed
    1. Zhao Y, Zou W, Du J, Zhao Y. The origins and homeostasis of monocytes and tissue-resident macrophages in physiological situation. J Cell Physiol. (2018) 233:6425–39. 10.1002/jcp.26461 - DOI - PubMed
    1. Wynn TA, Chawla A, Pollard JW. Macrophage biology in development, homeostasis and disease. Nature (2013) 496:445–55. 10.1038/nature12034 - DOI - PMC - PubMed
    1. Haldar M, Murphy KM. Origin, development, and homeostasis of tissue-resident macrophages. Immunol Rev. (2014) 262:25–35. 10.1111/imr.12215 - DOI - PMC - PubMed

Publication types

MeSH terms