

mPGES-1-Mediated Production of PGE2 and EP4 Receptor Sensing Regulate T Cell Colonic Inflammation
- PMID: 30619314
- PMCID: PMC6302013
- DOI: 10.3389/fimmu.2018.02954
mPGES-1-Mediated Production of PGE2 and EP4 Receptor Sensing Regulate T Cell Colonic Inflammation
Abstract
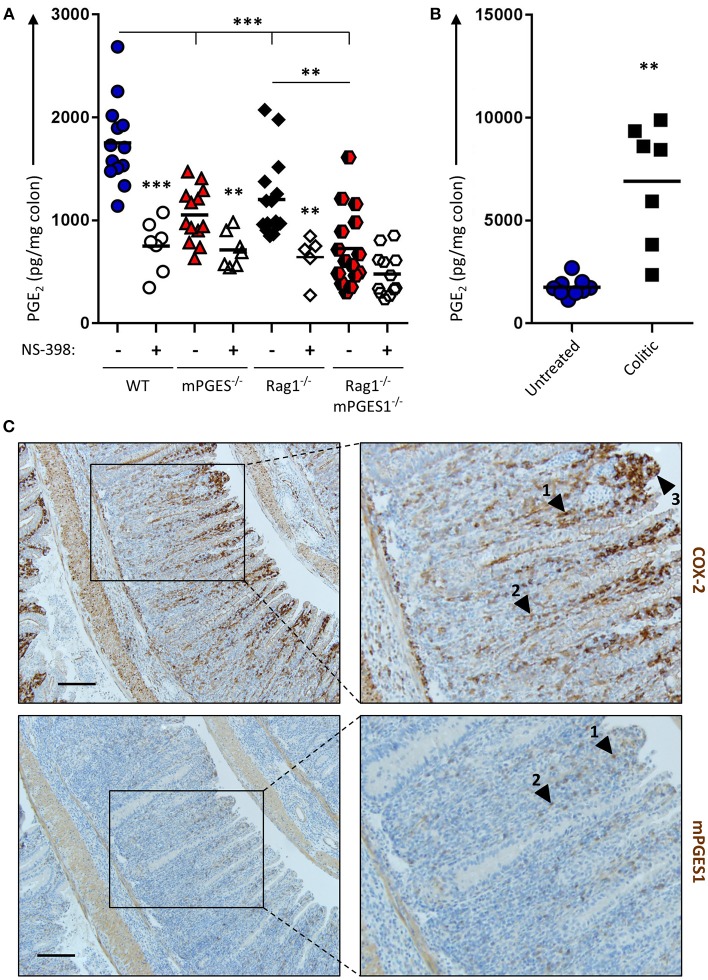
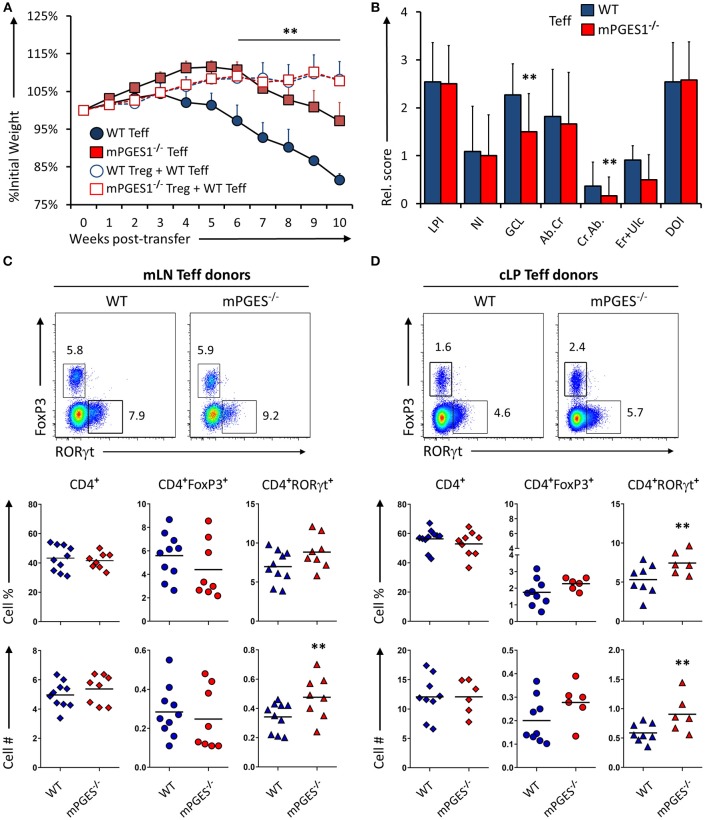
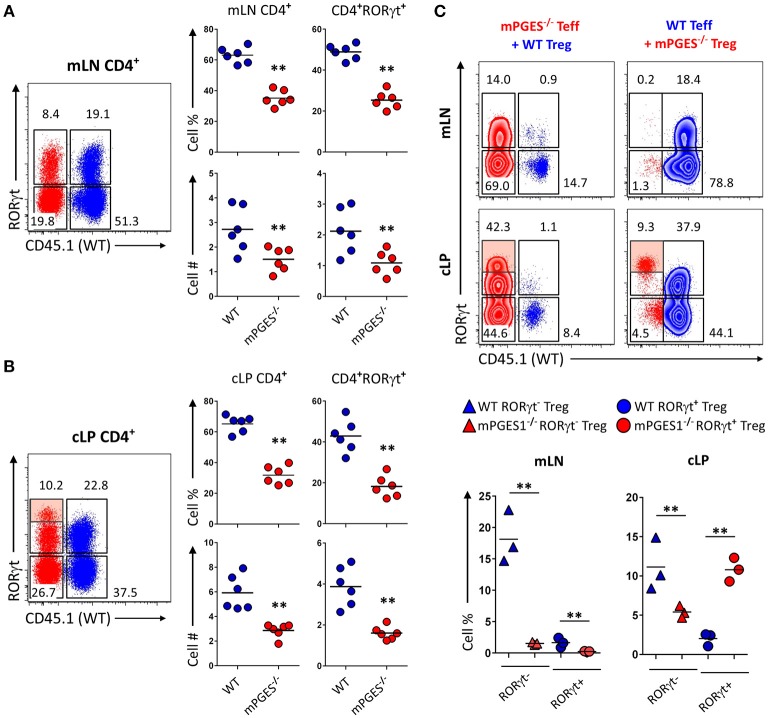
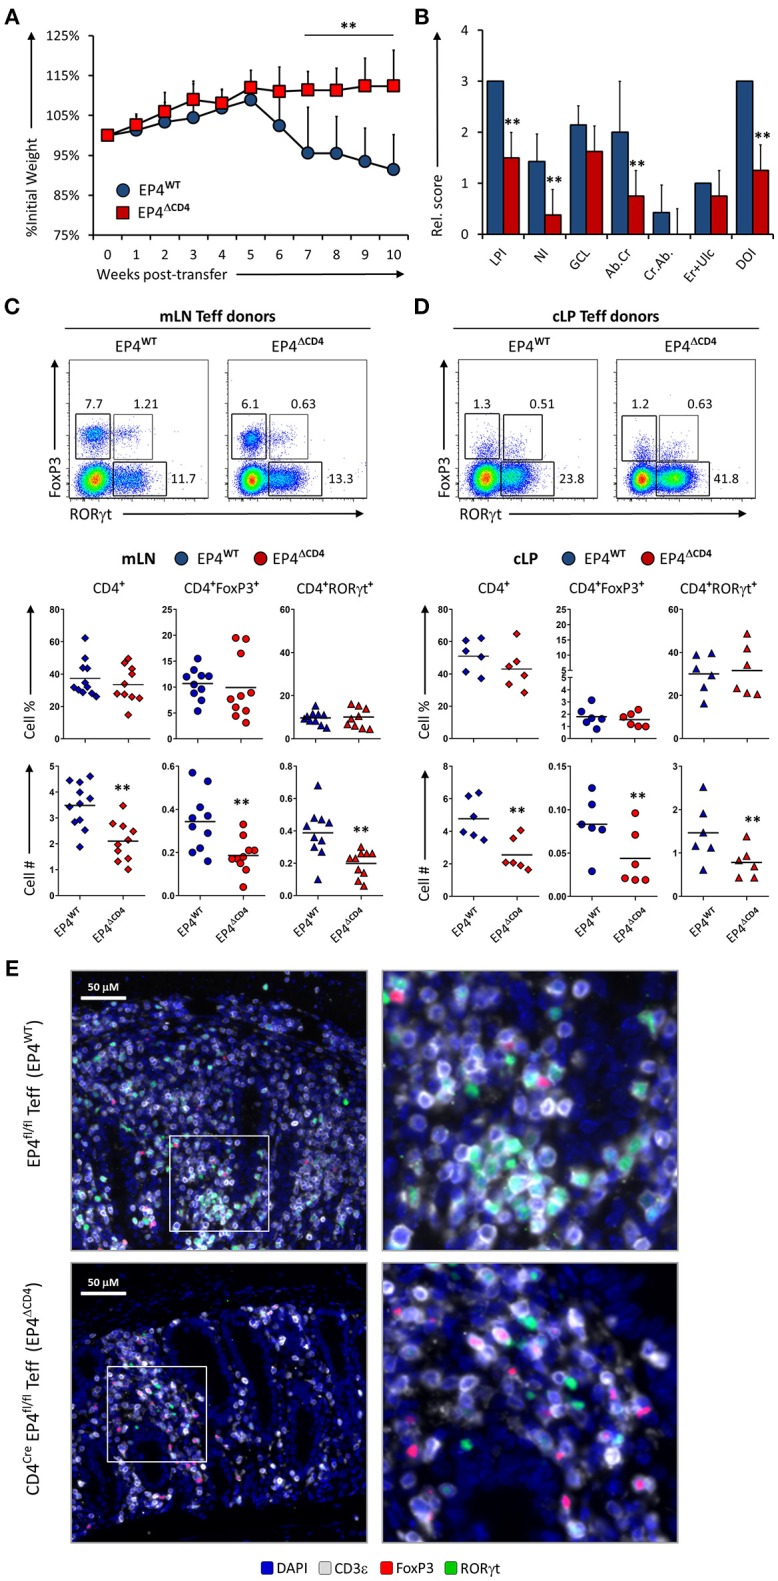
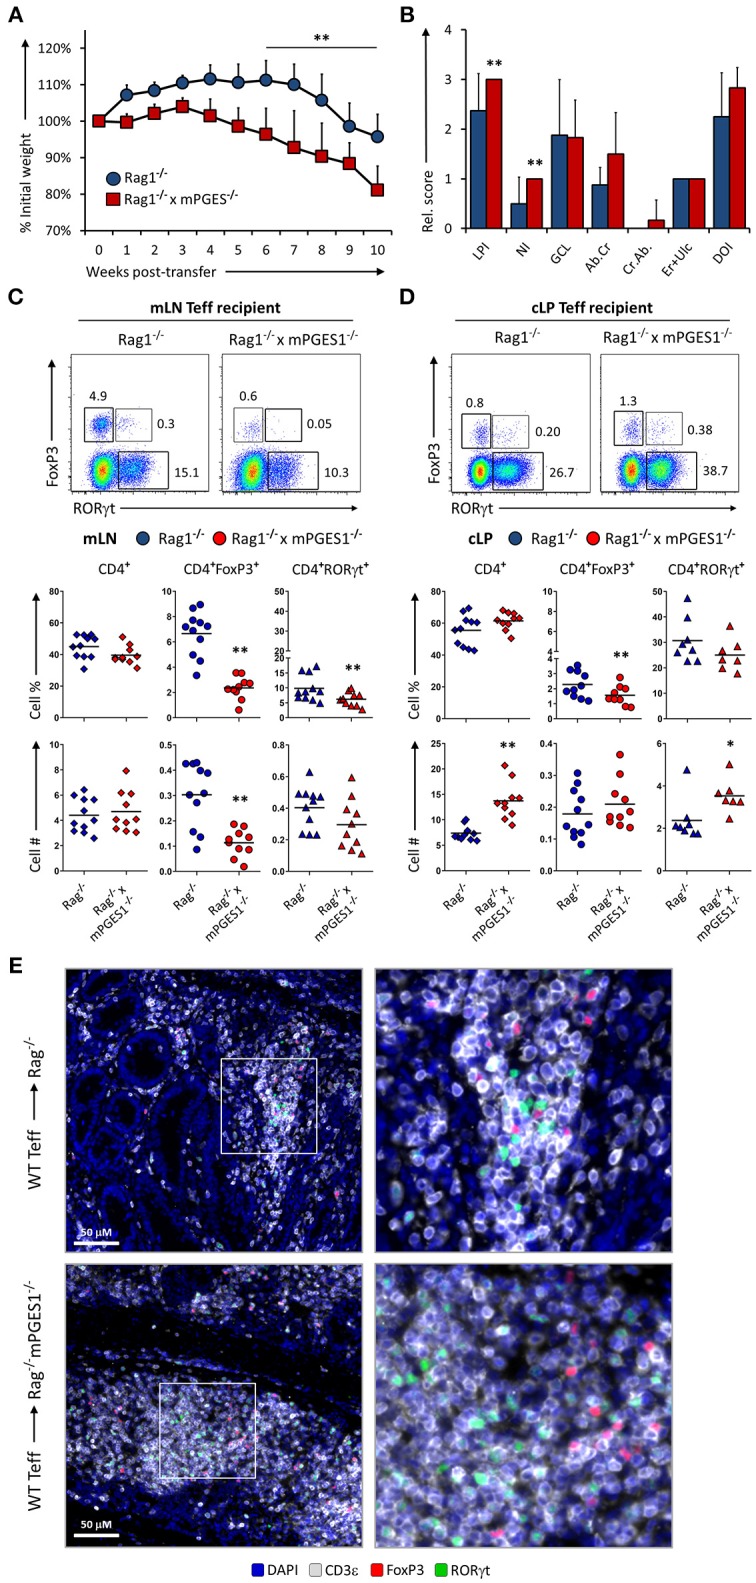
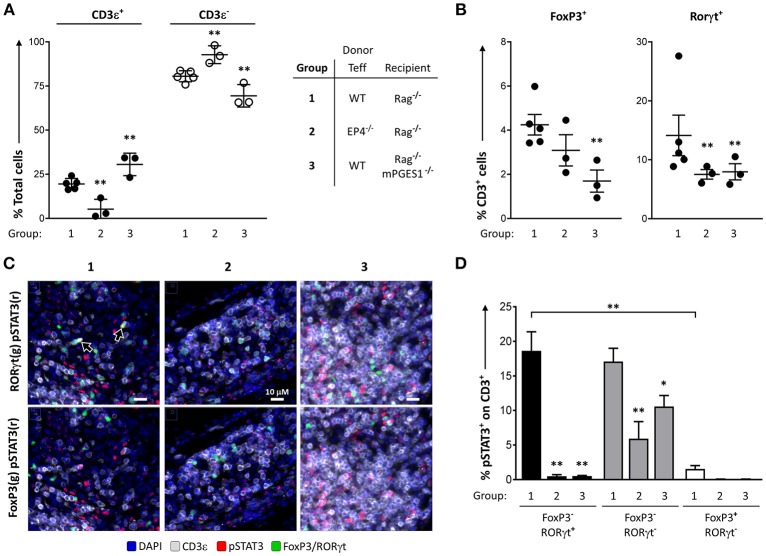
PGE2 is a lipid mediator of the initiation and resolution phases of inflammation, as well as a regulator of immune system responses to inflammatory events. PGE2 is produced and sensed by T cells, and autocrine or paracrine PGE2 can affect T cell phenotype and function. In this study, we use a T cell-dependent model of colitis to evaluate the role of PGE2 on pathological outcome and T-cell phenotypes. CD4+ T effector cells either deficient in mPGES-1 or the PGE2 receptor EP4 are less colitogenic. Absence of T cell autocrine mPGES1-dependent PGE2 reduces colitogenicity in association with an increase in CD4+RORγt+ cells in the lamina propria. In contrast, recipient mice deficient in mPGES-1 exhibit more severe colitis that corresponds with a reduced capacity to generate FoxP3+ T cells, especially in mesenteric lymph nodes. Thus, our research defines how mPGES-1-driven production of PGE2 by different cell types in distinct intestinal locations impacts T cell function during colitis. We conclude that PGE2 has profound effects on T cell phenotype that are dependent on the microenvironment.
Keywords: IBD–inflammatory bowel diseases; PGE2; T cell; Th17 & Tregs cells; Th17 activation; Treg = regulatory T cell; colitis; inflammation immunomodulation.
Figures
Similar articles
-
mPGES1-Dependent Prostaglandin E2 (PGE2) Controls Antigen-Specific Th17 and Th1 Responses by Regulating T Autocrine and Paracrine PGE2 Production.J Immunol. 2018 Jan 15;200(2):725-736. doi: 10.4049/jimmunol.1601808. Epub 2017 Dec 13. J Immunol. 2018. PMID: 29237778 Free PMC article.
-
Endogenous prostaglandin E2 amplifies IL-33 production by macrophages through an E prostanoid (EP)2/EP4-cAMP-EPAC-dependent pathway.J Biol Chem. 2017 May 19;292(20):8195-8206. doi: 10.1074/jbc.M116.769422. Epub 2017 Mar 24. J Biol Chem. 2017. PMID: 28341741 Free PMC article.
-
Protective Role of mPGES-1 (Microsomal Prostaglandin E Synthase-1)-Derived PGE2 (Prostaglandin E2) and the Endothelial EP4 (Prostaglandin E Receptor) in Vascular Responses to Injury.Arterioscler Thromb Vasc Biol. 2018 May;38(5):1115-1124. doi: 10.1161/ATVBAHA.118.310713. Epub 2018 Mar 29. Arterioscler Thromb Vasc Biol. 2018. PMID: 29599139 Free PMC article.
-
Prostaglandin E2-induced inflammation: Relevance of prostaglandin E receptors.Biochim Biophys Acta. 2015 Apr;1851(4):414-21. doi: 10.1016/j.bbalip.2014.07.008. Epub 2014 Jul 17. Biochim Biophys Acta. 2015. PMID: 25038274 Review.
-
Anti-inflammation therapy by activation of prostaglandin EP4 receptor in cardiovascular and other inflammatory diseases.J Cardiovasc Pharmacol. 2012 Feb;59(2):116-23. doi: 10.1097/FJC.0b013e3182244a12. J Cardiovasc Pharmacol. 2012. PMID: 21697732 Free PMC article. Review.
Cited by
-
Facilitation of colonic T cell immune responses is associated with an exacerbation of dextran sodium sulfate-induced colitis in mice lacking microsomal prostaglandin E synthase-1.Inflamm Regen. 2022 Jan 4;42(1):1. doi: 10.1186/s41232-021-00188-1. Inflamm Regen. 2022. PMID: 34983695 Free PMC article.
-
Latest progress in the development of cyclooxygenase-2 pathway inhibitors targeting microsomal prostaglandin E2 synthase-1.Future Med Chem. 2022 Mar;14(6):385-388. doi: 10.4155/fmc-2021-0317. Epub 2022 Jan 5. Future Med Chem. 2022. PMID: 34985304 Free PMC article. No abstract available.
-
Prostanoids and Resolution of Inflammation - Beyond the Lipid-Mediator Class Switch.Front Immunol. 2021 Jul 12;12:714042. doi: 10.3389/fimmu.2021.714042. eCollection 2021. Front Immunol. 2021. PMID: 34322137 Free PMC article. Review.
-
Enhanced mPGES-1 Contributes to PD-Related Peritoneal Fibrosis via Activation of the NLRP3 Inflammasome.Front Med (Lausanne). 2021 May 18;8:675363. doi: 10.3389/fmed.2021.675363. eCollection 2021. Front Med (Lausanne). 2021. PMID: 34084773 Free PMC article.
-
Epi-revolution in rheumatology: the potential of histone deacetylase inhibitors for targeted rheumatoid arthritis intervention.Inflammopharmacology. 2024 Aug;32(4):2109-2123. doi: 10.1007/s10787-024-01486-z. Epub 2024 May 7. Inflammopharmacology. 2024. PMID: 38714604 Free PMC article. Review.
References
Publication types
MeSH terms
Substances
Grants and funding
LinkOut - more resources
Full Text Sources
Molecular Biology Databases
Research Materials