. 2018 Dec 20:9:1863.
doi: 10.3389/fpls.2018.01863. eCollection 2018.

Waterlogging of Winter Crops at Early and Late Stages: Impacts on Leaf Physiology, Growth and Yield

Affiliations

Waterlogging of Winter Crops at Early and Late Stages: Impacts on Leaf Physiology, Growth and Yield

Rocío Antonella Ploschuk et al. Front Plant Sci. .

Erratum in

Abstract

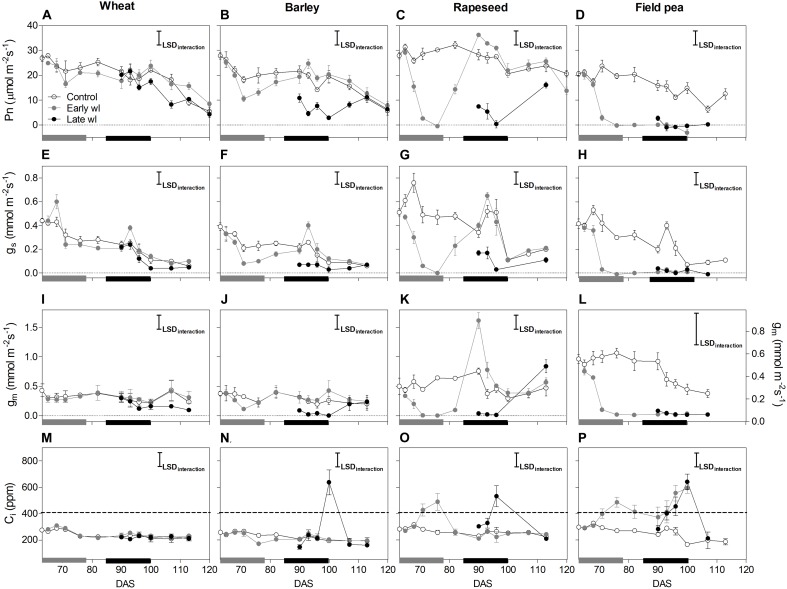
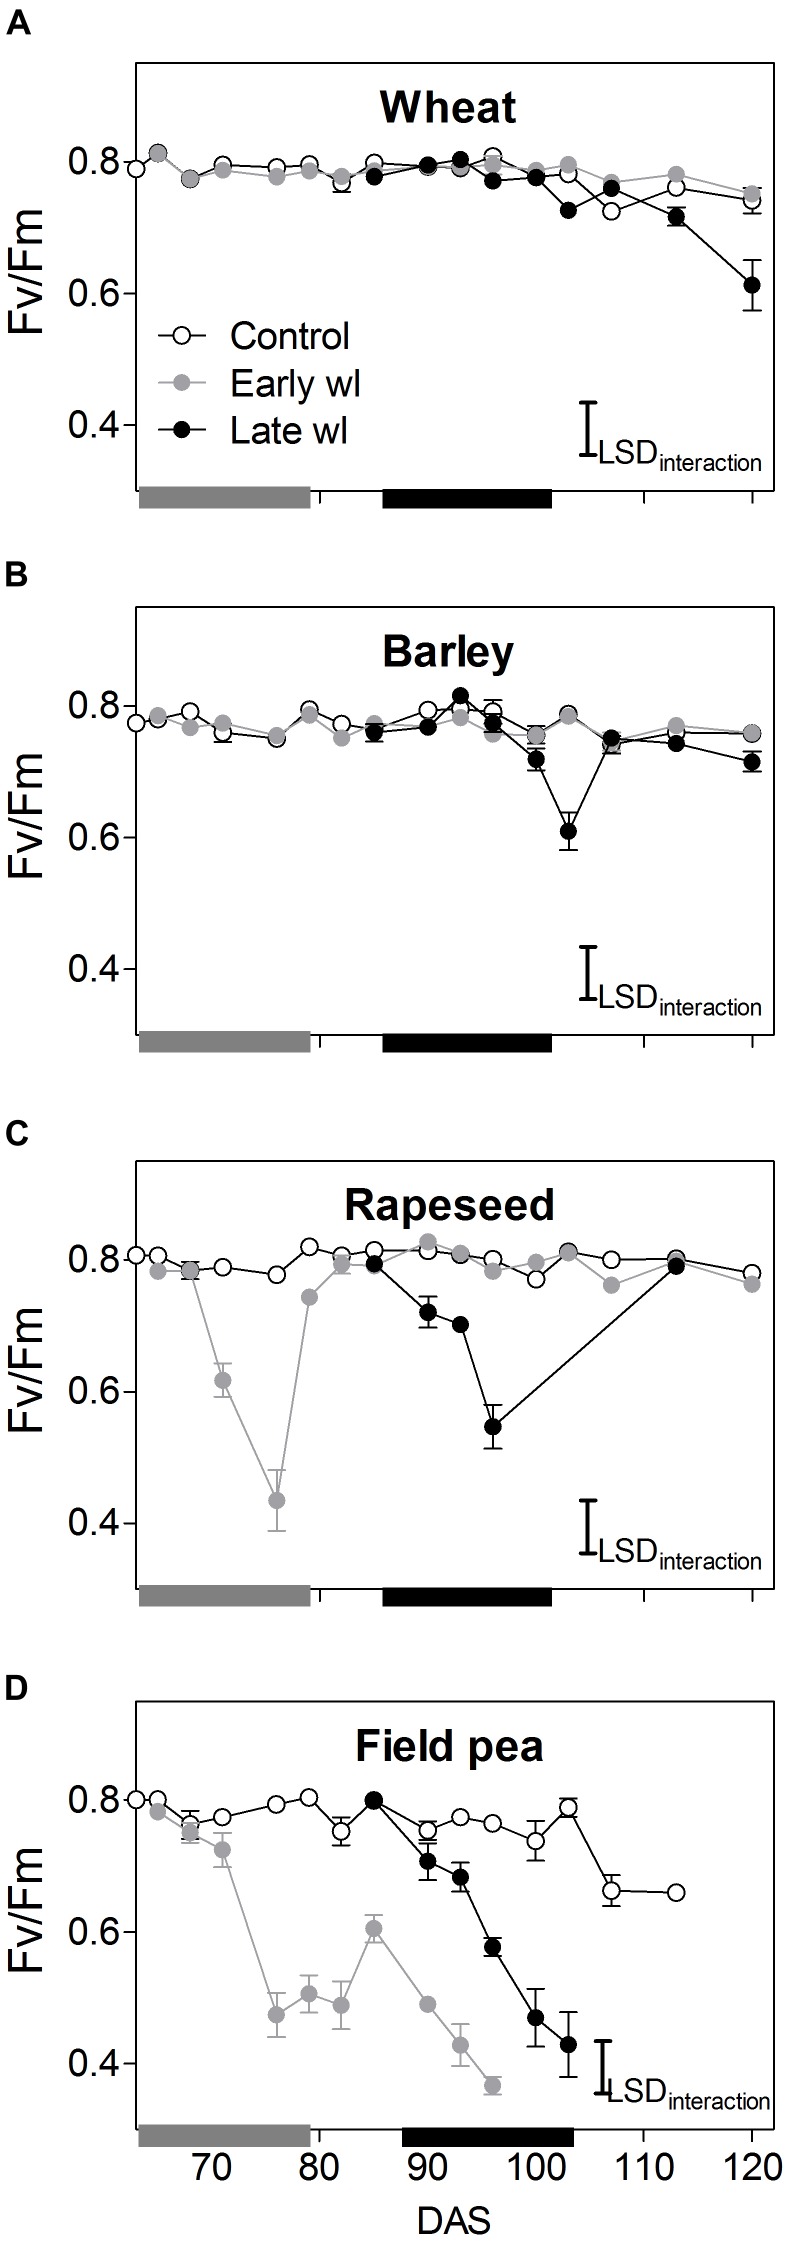
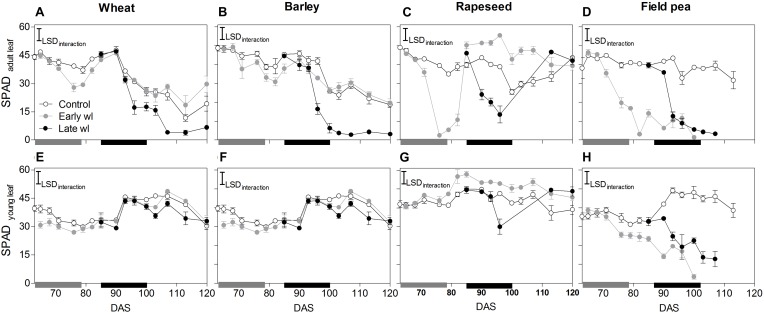
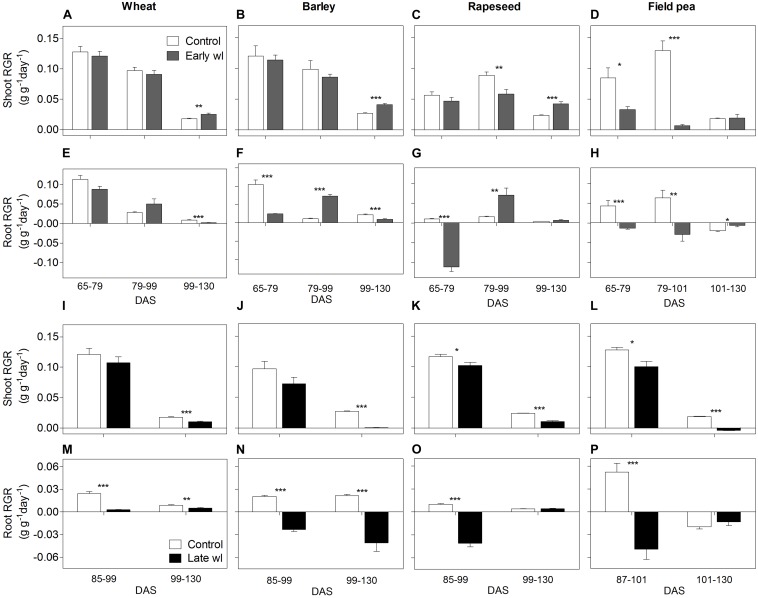
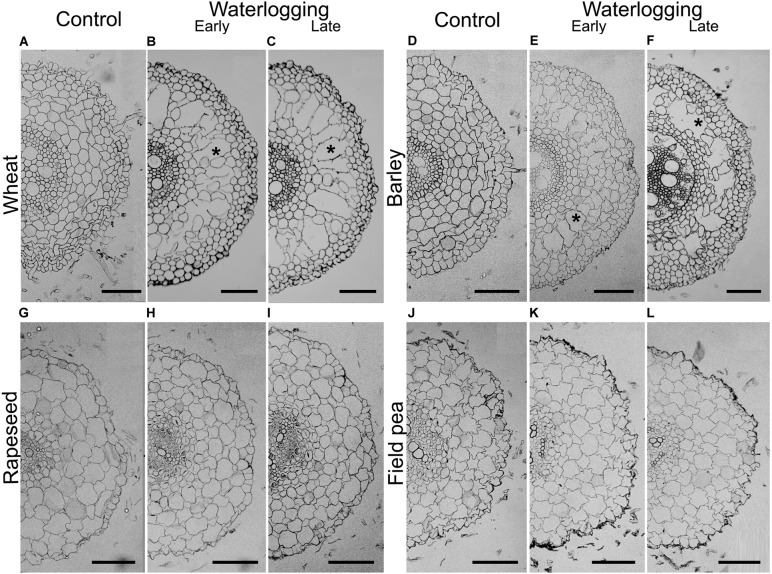
Waterlogging is expected to increase as a consequence of global climate change, constraining crop production in various parts of the world. This study assessed tolerance to 14-days of early- or late-stage waterlogging of the major winter crops wheat, barley, rapeseed and field pea. Aerenchyma formation in adventitious roots, leaf physiological parameters (net photosynthesis, stomatal and mesophyll conductances, chlorophyll fluorescence), shoot and root growth during and after waterlogging, and seed production were evaluated. Wheat produced adventitious roots with 20-22% of aerenchyma, photosynthesis was maintained during waterlogging, and seed production was 86 and 71% of controls for early- and late-waterlogging events. In barley and rapeseed, plants were less affected by early- than by late-waterlogging. Barley adventitious roots contained 19% aerenchyma, whereas rapeseed did not form aerenchyma. In barley, photosynthesis was reduced during early-waterlogging mainly by stomatal limitations, and by non-stomatal constraints (lower mesophyll conductance and damage to photosynthetic apparatus as revealed by chlorophyll fluorescence) during late-waterlogging. In rapeseed, photosynthesis was mostly reduced by non-stomatal limitations during early- and late-waterlogging, which also impacted shoot and root growth. Early-waterlogged plants of both barley and rapeseed were able to recover in growth upon drainage, and seed production reached ca. 79-85% of the controls, while late-waterlogged plants only attained 26-32% in seed production. Field pea showed no ability to develop root aerenchyma when waterlogged, and its photosynthesis (and stomatal and mesophyll conductances) was rapidly decreased by the stress. Consequently, waterlogging drastically reduced field pea seed production to 6% of controls both at early- and late-stages with plants being unable to resume growth upon drainage. In conclusion, wheat generates a set of adaptive responses to withstand 14 days of waterlogging, barley and rapeseed can still produce significant yield if transiently waterlogged during early plant stages but are more adversely impacted at the late stage, and field pea is not suitable for areas prone to waterlogging events of 14 days at either growth stage.

Keywords: aerenchyma; crops; photosynthesis; waterlogging; yield.


Figures

FIGURE 1
FIGURE 1
Net photosynthesis (Pn: A–D), stomatal conductance (gs: E–H), mesophyll conductance (gm: I–L) and internal CO2 (Ci: M–P) of control, early-waterlogged (Early wl) and late-waterlogged (Late wl) plants of wheat (A,E,I,M), barley (B,F,J,N), rapeseed (C,G,K,O) and field pea (D,H,L,P) on the top-most fully expanded leaves, over time (DAS is days after sowing). Note that the scale for gm of field pea (L) differs to those of the other species (I–K). Measurements were taken under saturating light of 1500 mmol m-2 s-1 PPFD provided by the 6400-40 leaf chamber fluorometer using a mix of 90% red and 10% blue light. Air flow, CO2 concentration in the reference chamber and block temperature were automatically controlled by the equipment at 300 mmol s-1, 400 μmol mol-1 (ppm) and 24°C, respectively. Gray and black bars on the x-axis represent the 14-day early- and late- waterlogging periods, respectively. The dashed horizontal line in (M–P) indicates external CO2. Pn LSDinteraction = 4.99 μmol m-2 s-1; gs LSDinteraction = 0.10 mmol m-2 s-1; gm LSDinteraction = 0.26 mmol m-2 s-1, Ci LSDinteraction = 111 ppm. The bars represent the LSD (Fisher’s protected least significant difference at P = 0.05). ANOVA results are presented in Table 2. Values are means ± standard errors of four replicates. Measurements for rapeseed at 100 and 107 DAS are missing because of complete leaf abscission, after which the newly sprouted leaves were big enough to measure.
FIGURE 2
FIGURE 2
Chlorophyll fluorescence (Fv/Fm) of control, early-waterlogged (Early wl) and late- waterlogged (Late wl) plants of wheat (A), barley (B), rapeseed (C), and field pea (D) on the top-most fully expanded leaves, over time (DAS is days after sowing). Gray and black bars on the x-axis represent the 14-day early- and late-waterlogging periods, respectively. Fv/Fm LSDinteraction = 0.06. The bars represent the LSD (Fisher’s protected least significant difference at P = 0.05). ANOVA results are presented in Table 2. Values are means ± standard errors of five replicates. Measurements for rapeseed at 100, 103, and 107 DAS are missing because of complete leaf abscission, after which the newly sprouted leaves were big enough to measure.
FIGURE 3
FIGURE 3
Leaf greenness of adult leaves located on the basal third of the plant (SPADadultleaf: A–D) and from the top-most fully expanded leaf (SPADyoungleaf: E–H) of control, early- waterlogged (Early wl) and late-waterlogged (Late wl) plants of wheat (A,E), barley (B,F), rapeseed (C,G) and field pea (D,H), over time (DAS is days after sowing). Gray and black bars on the x-axis represent the 14-day early- and late-waterlogging periods, respectively. SPADadultleaf LSDinteraction = 5.90, SPADyoungleaf LSDinteraction = 5.79. The bars represent the LSD (Fisher’s protected least significant difference at P = 0.05). Values are means ± standard errors of five replicates. Measurements for rapeseed at 100, 103, and 107 DAS are missing because of complete leaf abscission, after which the newly sprouted leaves were big enough to measure.
FIGURE 4
FIGURE 4
Shoot and root relative growth rate (RGR) of control vs. early-waterlogged plants (Early wl) (A–D; E–H, respectively) and control vs. late-waterlogged plants (Late wl) (I–L; M–P, respectively) of wheat (A,E,I,M), barley (B,F,J,N), rapeseed (C,G,K,O), and field pea (D,H,L,P), over time (DAS is days after sowing). RGRs comparisons from control vs. early-waterlogged plants considered three periods: early-waterlogging [65–79 days after sowing (DAS)], early recovery (79–99 DAS excepting for field pea, which occurred at 79–101 DAS) and late recovery (99–130 DAS excepting for field pea, which occurred 101–130 DAS). RGRs comparisons from controls vs. late-waterlogged plants considered two periods: late-waterlogging (85–99 DAS excepting for field pea, which was during 87–101 DAS) and the recovery until the end of the experiment (99–130 DAS excepting for field pea, which lasted from 101 to 130 DAS). Asterisks indicate significant differences between treatments within species (P = 0.05, ∗∗P = 0.01, ∗∗∗P = 0.001). Values are means ± standard errors of 6 replicates.
FIGURE 5
FIGURE 5
Adventitious root cross sections of control (A,D,G,J), early (B,E,H,K) and late waterlogged (C,F,I,L) plants of wheat (A–C), barley (D–F), rapeseed (G–I) and field pea (J–L). Cross-sections were taken at 20 mm from the root apex of 25–40-mm-roots. Asterisks denote examples of aerenchyma lacunae. Scale bars represent 100 μm. Values of aerenchyma percentage for wheat were 2.0 ± 0.6%, 20.4 ± 4.4%, and 22.2 ± 2.9% for control, early- and late-waterlogged plants, respectively. Barley presented values of 1.5 ± 0.5%, 18.9 ± 3.6%, and 13.9 ± 3.3% for control, early- and late-waterlogged plants, respectively. Rapeseed and field pea did not show any signs of aerenchyma formation under any treatment.

References

    1. Araki H., Hamada A., Hossain M. A., Takahashi T. (2012). Waterlogging at jointing and/or after anthesis in wheat induces early leaf senescence and impairs grain filling. Field Crops Res. 137 27–36. 10.1016/j.fcr.2012.09.006 - DOI
    1. Armstrong W. (1979). Aeration in higher plants. Adv. Bot. Res. 7 225–332. 10.1016/S0065-2296(08)60089-0 - DOI
    1. Ashraf M. A. (2012). Waterlogging stress in plants: a review. Afr. J. Agric. Res. 7 1976–1981. 10.5897/AJAR2016.12050 - DOI
    1. Barbour M. M., Warren C. R., Farquhar G. D., Forrester G. U. Y., Brown H. (2010). Variability in mesophyll conductance between barley genotypes, and effects on transpiration efficiency and carbon isotope discrimination. Plant Cell Environ. 33 1176–1185. 10.1111/j.1365-3040.2010.02138.x - DOI - PubMed
    1. Belford R. K., Cannell R. Q., Thomson R. J., Dennis C. W. (1980). Effects of waterlogging at different stages of development on the growth and yield of peas (Pisumsativum L.). J. Sci. Food Agric. 31 857–869. 10.1002/jsfa.2740310902 - DOI

LinkOut - more resources