. 2018 Dec 18:9:1864.
doi: 10.3389/fpls.2018.01864. eCollection 2018.

Revisiting the Soybean GmNAC Superfamily

Affiliations

Revisiting the Soybean GmNAC Superfamily

Bruno P Melo et al. Front Plant Sci. .

Abstract

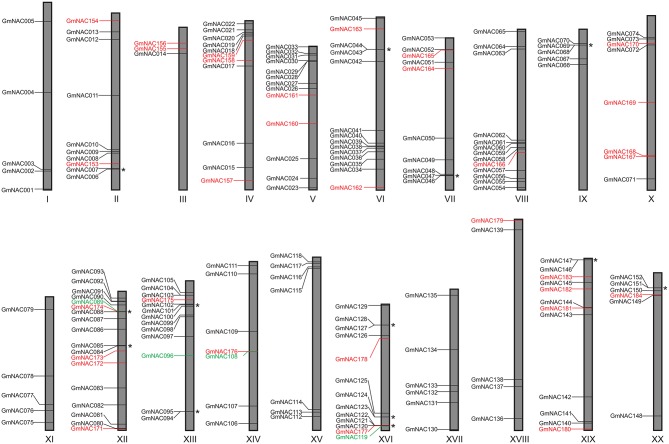
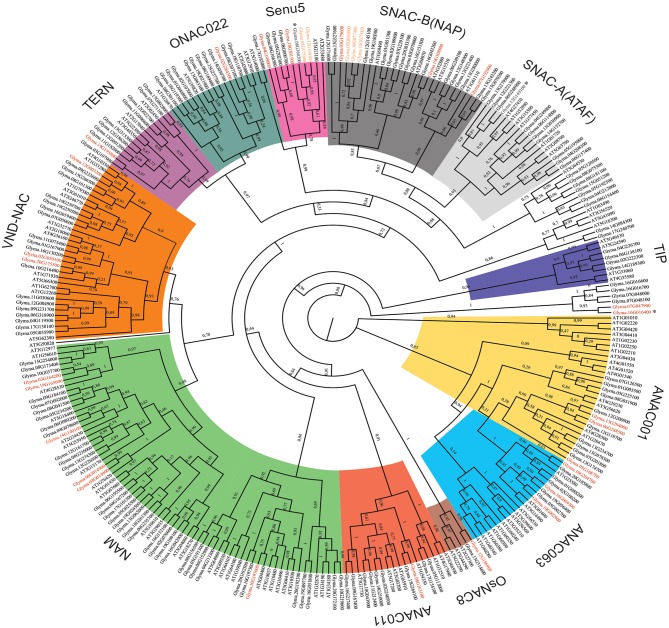
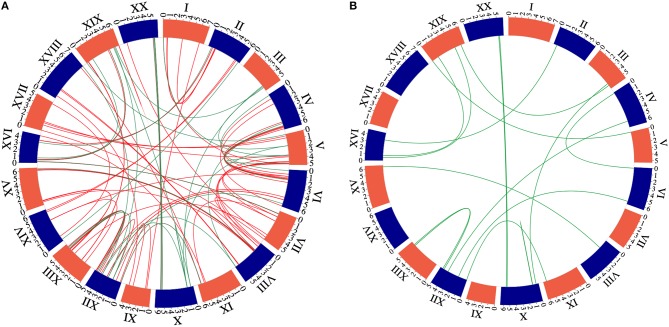
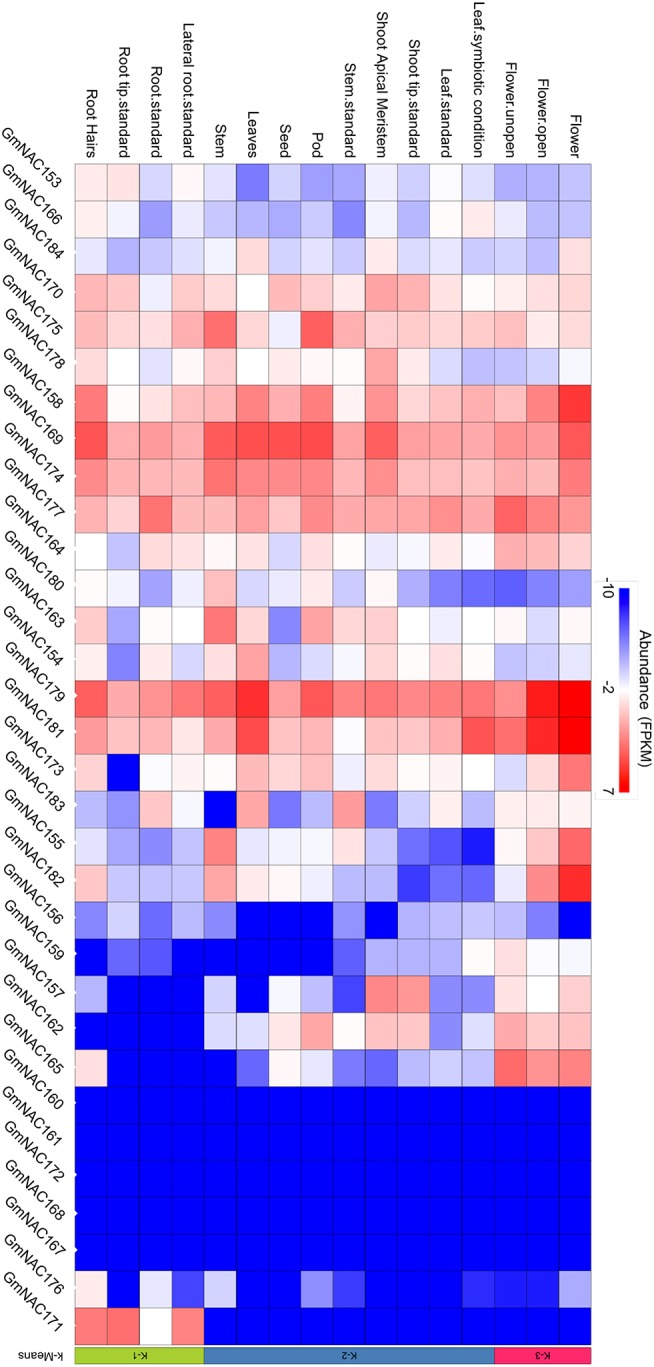
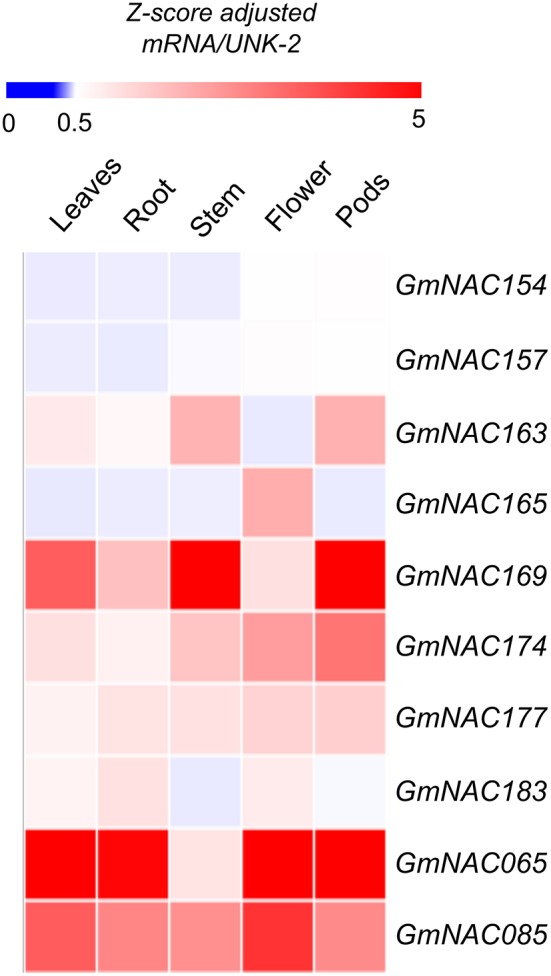
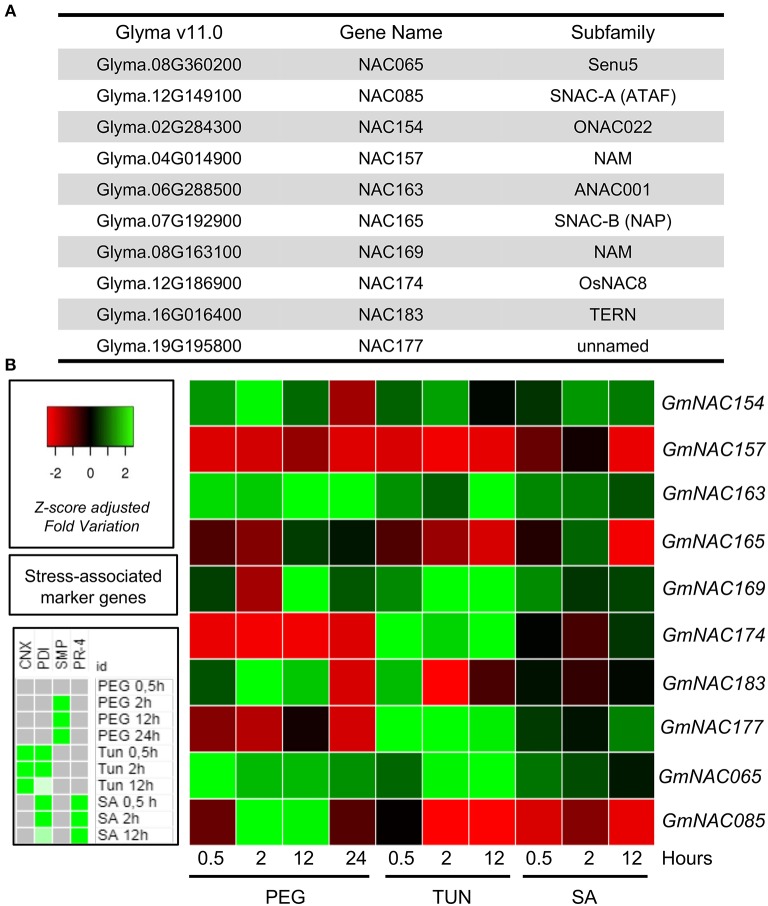
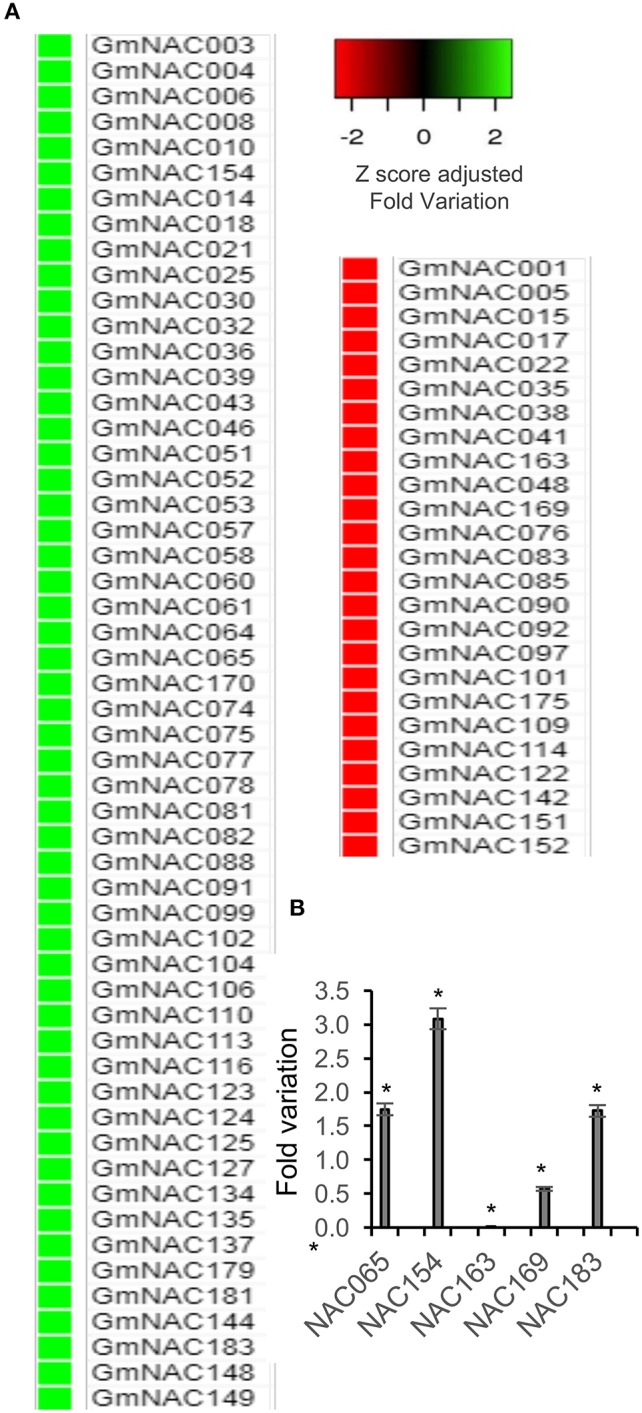
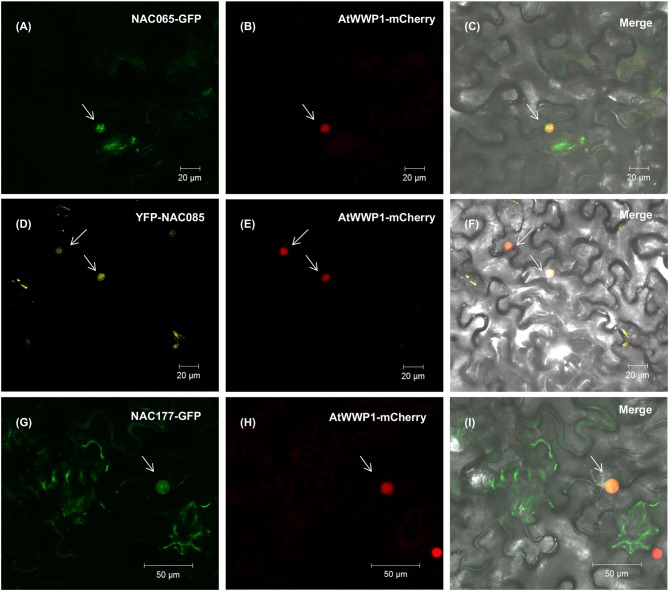
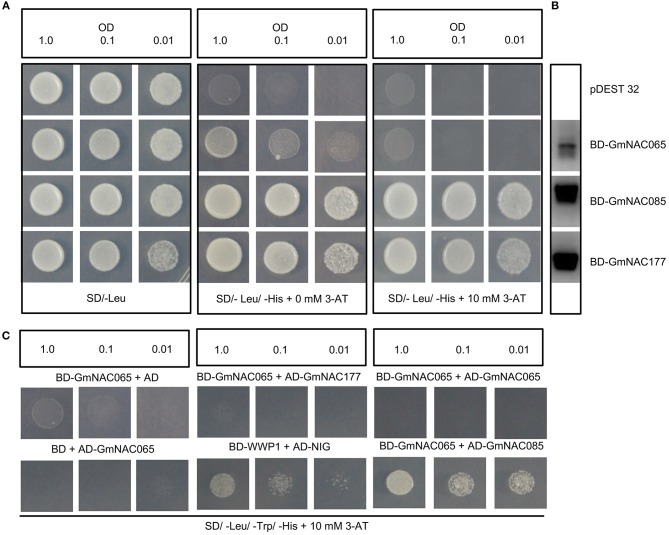
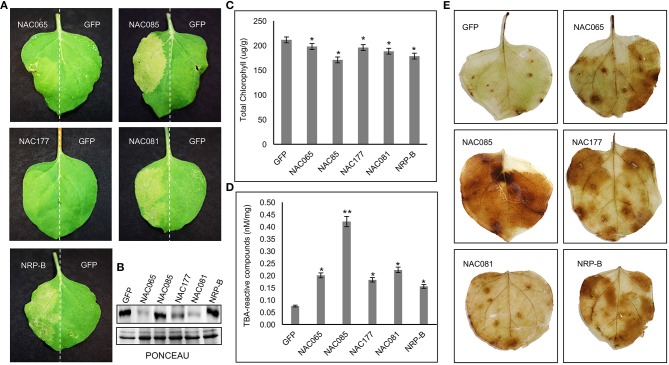
The NAC (NAM, ATAF, and CUC) genes encode transcription factors involved with the control of plant morph-physiology and stress responses. The release of the last soybean (Glycine max) genome assembly (Wm82.a2.v1) raised the possibility that new NAC genes would be present in the soybean genome. Here, we interrogated the last version of the soybean genome against a conserved NAC domain structure. Our analysis identified 32 putative novel NAC genes, updating the superfamily to 180 gene members. We also organized the genes in 15 phylogenetic subfamilies, which showed a perfect correlation among sequence conservation, expression profile, and function of orthologous Arabidopsis thaliana genes and NAC soybean genes. To validate our in silico analyses, we monitored the stress-mediated gene expression profiles of eight new NAC-genes by qRT-PCR and monitored the GmNAC senescence-associated genes by RNA-seq. Among ER stress, osmotic stress and salicylic acid treatment, all the novel tested GmNAC genes responded to at least one type of stress, displaying a complex expression profile under different kinetics and extension of the response. Furthermore, we showed that 40% of the GmNACs were differentially regulated by natural leaf senescence, including eight (8) newly identified GmNACs. The developmental and stress-responsive expression profiles of the novel NAC genes fitted perfectly with their phylogenetic subfamily. Finally, we examined two uncharacterized senescence-associated proteins, GmNAC065 and GmNAC085, and a novel, previously unidentified, NAC protein, GmNAC177, and showed that they are nuclear localized, and except for GmNAC065, they display transactivation activity in yeast. Consistent with a role in leaf senescence, transient expression of GmNAC065 and GmNAC085 induces the appearance of hallmarks of leaf senescence, including chlorophyll loss, leaf yellowing, lipid peroxidation and accumulation of H2O2. GmNAC177 was clustered to an uncharacterized subfamily but in close proximity to the TIP subfamily. Accordingly, it was rapidly induced by ER stress and by salicylic acid under late kinetic response and promoted cell death in planta. Collectively, our data further substantiated the notion that the GmNAC genes display functional and expression profiles consistent with their phylogenetic relatedness and established a complete framework of the soybean NAC superfamily as a foundation for future analyses.

Keywords: GmNAC superfamily; NAC; genome-wide expression profiling; phylogenetic analysis; senescence-associated genes; soybean; transcriptional factors.


Figures

Figure 1
Figure 1
Graphical representation of the location for the GmNACs on the soybean chromosomes. Previously described genes are indicated in black, and the newly identified genes are in red. GmNACs in green represent the previously identified ones, which were no longer found in the soybean genome reassembly. The asterisks indicate tandem duplicated genes.
Figure 2
Figure 2
Phylogenetic reconstruction of the soybean and Arabidopsis thaliana NAC superfamily. All NAC deduced amino acid sequences from the soybean genome and the Arabidopsis thaliana genome were used to perform the phylogenetic analysis. Phylogenetic tree reconstruction was performed using the maximum likelihood statistical method with 10.000 bootstraps. NAC genes were grouped into 15 subgroups, including SNAC-A (ATAF—light gray), SNAC-B (NAP—dark gray), Senu5 (pink), ONAC022 (dark green), TERN (purple), VND-NAC (vascular related NAC-domain - orange), NAM (no apical meristem - light green), ANAC011 (red), OsNAC8 (brown), ANAC063 (light blue), ANAC001 (yellow), TIP (turnip crinkle virus interaction protein - dark blue) and unnamed groups (white). New putative NAC genes are shown in red. Asterisks indicate genes that were further characterized. Some possible pseudo-genes are shown in orange. The bootstrap score to each phylogenetic relation is shown at nodes.
Figure 3
Figure 3
Circle plot of the soybean chromosomes and the GmNAC family. A. Circle plot of the soybean chromosomes showing the location of the new 32 NACs genes compared with the former NAC group. The green color represents 21 new NAC genes presented at the pairs of paralogous comparing with all NAC genes. We used the criterion of 80% identity to recover the paralogous pairs. B. Circle plot of soybean chromosomes and the 21 newly identified NAC genes displayed as duplicated gene pairs based on the phylogenetic analysis.
Figure 4
Figure 4
Organ and tissue-specific expression of the new NAC genes. The heat map plot was created by the PhytoMine tool (https://phytozome.jgi.doe.gov/phytomine/begin.do) presented at the Phytozome v12 website (https://phytozome.jgi.doe.gov). The heat map was built using all gene expression data at the database regarding tissue- and organ-specific expression.
Figure 5
Figure 5
GmNAC gene expression profile in different soybean tissues. Heat map of 8 putative NAC genes in addition to GmNAC065 and GmNAC85. The expression levels of a randomly selected representative sample of new GmNAC genes were measured in R2/R3 plants under normal growth conditions by qRT-PCR. The UNK-2 gene was used as endogenous control. The data displayed in the figure comprise the qRT-PCR from Supplementary Figure 3 and Supplementary Table 5.
Figure 6
Figure 6
Expression patterns of new GmNACs during multiple stress. (A) The identity of the selected GmNAC genes. (B) Heatmap of the stress-induced expression of 8 new putative GmNAC genes, GmNAC065 and GmNAC85. For the expression analysis of randomly selected GmNACs, soybean seedlings were stressed with PEG (10%), tunicamycin (5 μg/mL) and salicylic acid (5 mM) for 0.5, 4 and 12 h (24 h, exclusively for PEG treatment) and the transcript accumulation was monitored by qRT-PCR. The UNK-2 gene was used as endogenous control, and gene-associated stress markers were used to monitor the effectiveness of treatment (on the left). The data presented in the figure comprise the qRT-PCR from Supplementary Figures 4, 5 and Supplementary Table 6.
Figure 7
Figure 7
Expression profile of NAC genes during natural leaf senescence in soybean. (A) Heatmap of senescence-associated GmNAC genes. The data presented in the figure comprise an RNA-seq analysis showing the differential expression of NAC genes in BR16_80d (R7)-BR16_20d(V3). (B) Senescence-induced variation of expression for representative senescence-associated NAC genes. Total RNA was isolated from 20 DAG to 80 DAG soybean leaves and the transcript accumulation of the indicated genes was measured by qRT-PCR. UKN-2 was used as the normalizer, endogenous control gene. Relative gene expression was quantified using the comparative 2−ΔΔCt method. The bars indicate standard-error and the asterisks indicate statistical significance by the t-test, (P < 0.05, n = 3).
Figure 8
Figure 8
NAC065, NAC085, and NAC177 subcellular localization. Leaves of Nicothiana benthamiana were infiltrated with Agrobacterium tumefaciens GV3101 carrying the GFP-NAC or YFP-NAC constructs, and the localization of the fused protein was monitored by confocal microscopy. In the left column, (A,D,G) show the expression of NAC065-GFP, YFP-NAC085 and NAC177-GFP (top to bottom) in the nuclei, indicated by white arrows. In the middle column, (B,E,H) show the expression of the nuclear marker AtWWP1-mCerry in the corresponding nuclei field of the first column. (C,F,I) merged images of NAC fusions and AtWWP1 marker in the bright-field.
Figure 9
Figure 9
NAC065, NAC085 and NAC177 transactivation capacity and protein-protein interaction. (A) Transactivation activity of GmNAC proteins. The fusions BD-NAC065, BD-NAC085 and BD-NAC177, and the empty vector were transformed separately into yeast strains AH109 and activity was determined by monitoring His prototrophy on selective medium. The transformants were incubated for 3 days at 28°C in SD media lacking leucine and histidine but supplemented with 10 mM 3-aminotriazol (3AT). (B) Expression analysis of BD-NAC065, BD-NAC085 and BD-NAC177 fusions in yeast. Total RNA was extracted from yeast cells transformed with the indicated DNA constructs, and gene expression was monitored by RT-PCR. (C) Interactions of GmNAC065 with GmNAC085 in yeast. GmNAC065 was expressed in yeast as GAL4 binding domain (BD) fusion, and GmNAC085 and GmNAC177 were expressed in yeast as GAL4 activation domain (AD) fusions. Interactions between the tested proteins were examined by monitoring His prototrophy in the presence of 10 mM 3-AT. In the control experiments, the GmNAC065 fusions was expressed with the reciprocal empty vector (pBD or pAD).
Figure 10
Figure 10
Transient expression of NAC065, NAC085, and NAC177 induces cell death in planta. (A) Nicotiana benthamiana leaves were agroinfiltrated with GmNAC065-GFP, GmNAC085-GFP or GmNAC177-GFP on one side and the other half of the leaves was agroinfiltrated with GFP (as a negative control). GmNAC081 and NRP-B were used as positive controls. (B) Accumulation of NAC proteins in agroinfiltrated leaf sectors. Total proteins were extracted from agroinfiltrated leaf sectors and immunoblotted with an anti-GFP antibody (C) Total chlorophyll content 3 days after agroinfiltration. (D) TBA-reactive compounds accumulation after NAC expression. (E) DAB leaf-staining 3 days after agroinfiltration. The bars indicate standard-error and the asterisks indicate statistical significance by the t-test: *(P < 0.05, n = 3); **(P < 0.01, n = 3).

References

    1. Aida M., Ishida T., Fukaki H., Fujisawa H., Tasaka M. (1997). Genes involved in organ separation in Arabidopsis: an analysis of the cup-shaped cotyledon mutant. Plant Cell 9, 841–857. 10.1105/tpc.9.6.841 - DOI - PMC - PubMed
    1. Balazadeh S., Kwasniewski M., Caldana C., Mehrnia M., Zanor M. I., Xue G. P., et al. (2011). ORS1, an H2O2-responsive NAC transcription factor, controls senescence in Arabidopsis thaliana. Mol. Plant. 4, 346–360. 10.1093/mp/ssq080 - DOI - PMC - PubMed
    1. Balazadeh S., Siddiqui H., Allu A. D., Matallana-Ramirez L. P., Caldana C., Mehrnia M., et al. . (2010). A gene regulatory network controlled by the NAC transcription factor ANAC092/AtNAC2/ORE1 during salt-promoted senescence. Plant J. 62, 250–264. 10.1111/j.1365-313X.2010.04151.x - DOI - PubMed
    1. Block A., Toruño T. Y., Elowsky C. G., Zhang C., Steinbrenner J., Beynon J., et al. . (2014). The Pseudomonas syringae type III effector HopD1 suppresses effector-triggered immunity, localizes to the endoplasmic reticulum, and targets the Arabidopsis transcription factor NTL9. New Phytol. 201, 1358–1370. 10.1111/nph.12626 - DOI - PubMed
    1. Breeze E., Harrison E., McHattie S., Hughes L., Hickman R., Hill C., et al. . (2011). High-resolution temporal profiling of transcripts during Arabidopsis leaf senescence reveals a distinct chronology of processes and regulation. Plant Cell 23, 873–894. 10.1105/tpc.111.083345 - DOI - PMC - PubMed