. 2018 Dec 18:9:671.
doi: 10.3389/fgene.2018.00671. eCollection 2018.

UTRme: A Scoring-Based Tool to Annotate Untranslated Regions in Trypanosomatid Genomes

Affiliations

UTRme: A Scoring-Based Tool to Annotate Untranslated Regions in Trypanosomatid Genomes

Santiago Radío et al. Front Genet. .

Abstract

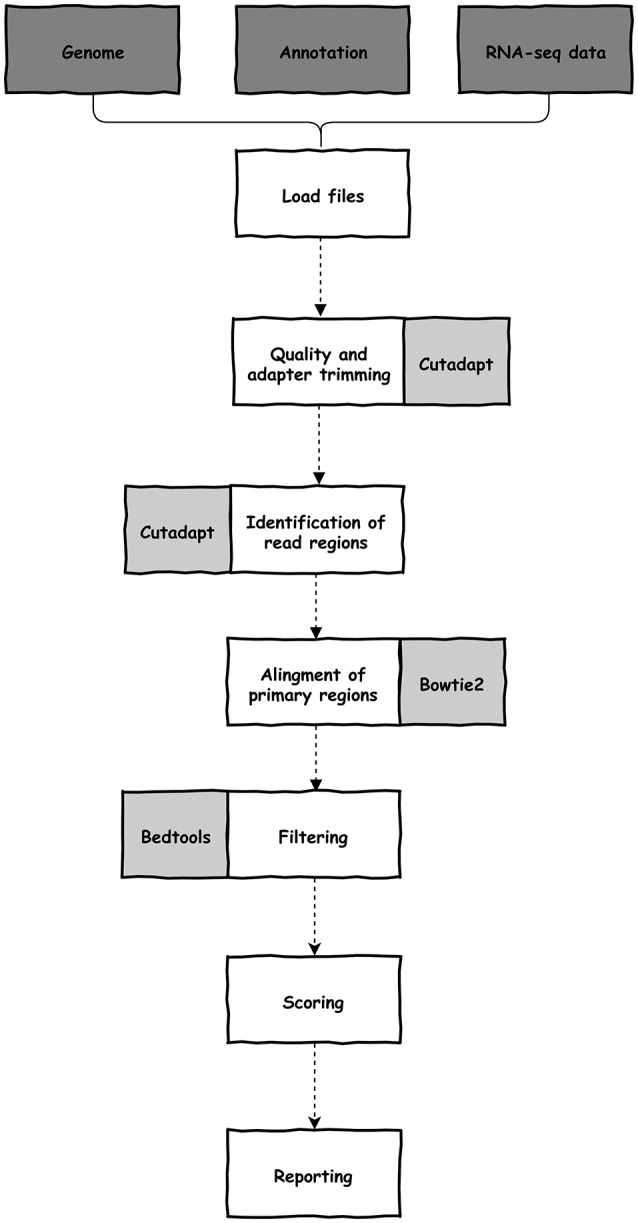
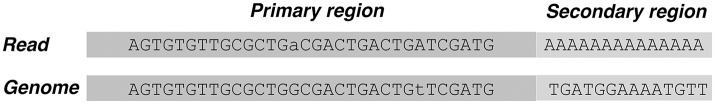
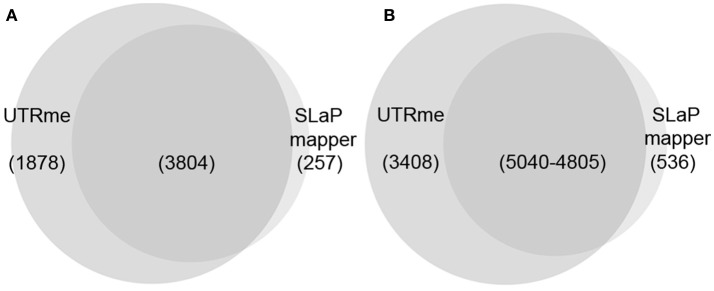
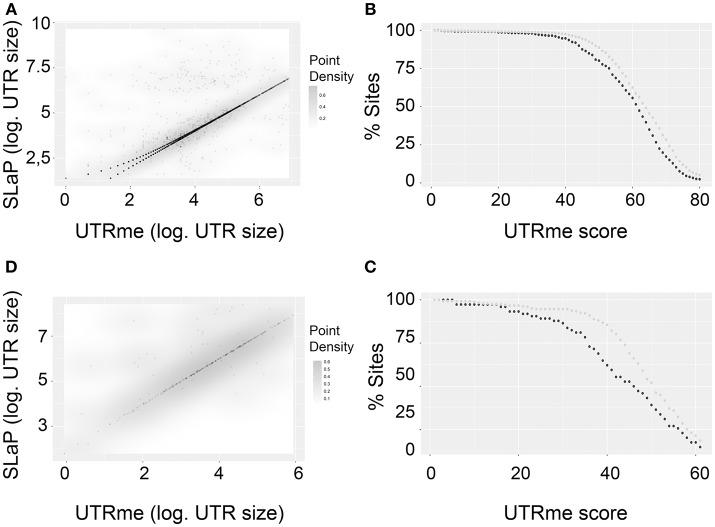
Most signals involved in post-transcriptional regulatory networks are located in the untranslated regions (UTRs) of the mRNAs. Therefore, to deepen our understanding of gene expression regulation, delimitation of these regions with high accuracy is needed. The trypanosomatid lineage includes a variety of parasitic protozoans causing a significant worldwide burden on human health. Given their peculiar mechanisms of gene expression, these organisms depend on post-transcriptional regulation as the main level of gene expression control. In this context, the definition of the UTR regions becomes of key importance. We have developed UTR-mini-exon (UTRme), a graphical user interface (GUI) stand-alone application to identify and annotate 5' and 3' UTR regions in a highly accurate way. UTRme implements a multiple scoring system tailored to address the issue of false positive UTR assignment that frequently arise because of the characteristics of the intergenic regions. Even though it was developed for trypanosomatids, the tool can be used to predict 3' sites in any eukaryote and 5' UTRs in any organism where trans-splicing occurs (such as the model organism C. elegans). UTRme offers a way for non-bioinformaticians to precisely determine UTRs from transcriptomic data. The tool is freely available via the conda and github repositories.

Keywords: GUI; UTR prediction software; post transcriptional regulation; prediction score; untranslated region.


Figures

Figure 1
Figure 1
Outline of the UTRme pipeline. Required initial files, data processing steps and software packages used during processing are depicted in dark gray, white and light gray backgrounds, respectively.
Figure 2
Figure 2
UTRme classification of read regions. Regions of each read and their counterparts in the genome are defined by UTRme as primary and secondary.
Figure 3
Figure 3
Example of UTRme summary plots output. Reported plots for the 5′ and 3′ UTRs predicted using T. cruzi epimastigote Y strain RNA-seq data from Li et al. (2016). Plots for 5′ and 3′ UTRs are in dark gray and light gray, respectively. (A) Kernel density estimation plot of UTR lengths. (B) Kernel density estimation plot of both 5′ and 3′ UTR score distribution. (C) Kernel density estimation plot for the number of 5′ and 3′ UTR sites. In all cases the median is indicated as a dotted line. (D) Central panel: Scatter plot of 5′ UTR scores vs occurrences. A higher point density is indicated by a darker color for each bin. Upper panel: histogram of occurrences. Right panel: histogram of scores.
Figure 4
Figure 4
UTRme accuracy assessment for 5′ UTRs. (A) Dependence of the number of true positives and false positives on the UTRme score (indicated as inserts). (B) False positive annotations are plotted as dots indicating their score and distance to the real processing site. The histogram shows the distribution of scores for all predicted sites.
Figure 5
Figure 5
Venn diagrams comparing the results of UTRme and SLaP mapper 5′ processing sites annotations. (A) The intersection of the genes predicted by each tool is shown. (B) For genes were annotations are available for both tools, the intersection of the sites predicted by each tool is shown.
Figure 6
Figure 6
Comparison of UTRme best scoring sites with the ones predicted by Slap mapper using Pastro et al. (2017) data. (A) Scatter plot of 5′ UTR lengths. Darker regions indicate higher density of points. (B) The percentage of points that have scores above a threshold is plotted for coincident and non-coincident sites. Dark gray: non-coincident sites. Light gray: coincident sites. The percentage was calculated until the number of sites remaining is above 10 (C,D). Same as (A,B) for 3′ UTRs.

References

    1. Bartholomeu D. C., Silva R. A., Galvao L. M., el-Sayed N. M., Donelson J. E., Teixeira S. M. (2002). Trypanosoma cruzi: RNA structure and post-transcriptional control of tubulin gene expression. Exp. Parasitol. 102, 123–133. 10.1016/S0014-4894(03)00034-1 - DOI - PubMed
    1. Bhatia V., Sinha M., Luxon B., Garg N. (2004). Utility of the Trypanosoma cruzi sequence database for identification of potential vaccine candidates by in silico and in vitro screening. Infect. Immun. 72, 6245–6254. 10.1128/IAI.72.11.6245-6254.2004 - DOI - PMC - PubMed
    1. Bontempi E. J., Porcel B. M., Henriksson J., Carlsson L., Rydaker M., Segura E. L., et al. (1994). Genes for histone H3 in Trypanosoma cruzi. Mol. Biochem. Parasitol. 66, 147–151. - PubMed
    1. Brehm K., Jensen K., Frosch M. (2000). mRNA trans-splicing in the human parasitic cestode Echinococcus multilocularis. J. Biol. Chem. 275, 38311–38318. 10.1074/jbc.M006091200 - DOI - PubMed
    1. Búa J., Aslund L., Pereyra N., Garcia G. A., Bontempi E. J., Ruiz A. M. (2001). Characterisation of a cyclophilin isoform in Trypanosoma cruzi. FEMS Microbiol. Lett. 200, 43–47. 10.1111/j.1574-6968.2001.tb10690.x - DOI - PubMed

LinkOut - more resources