

Sympatry or syntopy? Investigating drivers of distribution and co-occurrence for two imperiled sea turtle species in Gulf of Mexico neritic waters
- PMID: 30619571
- PMCID: PMC6308884
- DOI: 10.1002/ece3.4691
Sympatry or syntopy? Investigating drivers of distribution and co-occurrence for two imperiled sea turtle species in Gulf of Mexico neritic waters
Abstract
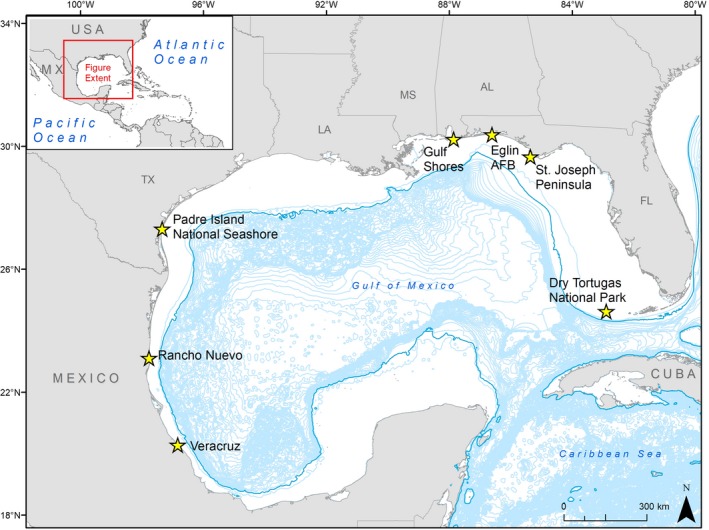
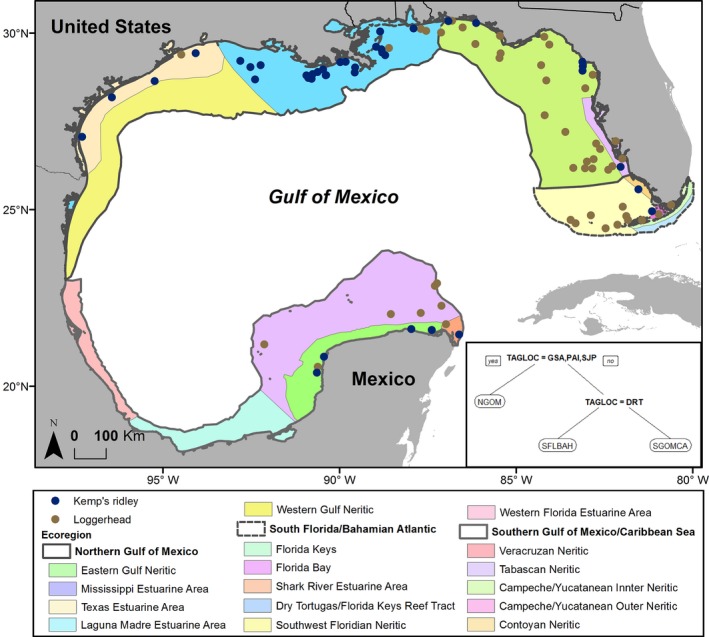
Animals co-occurring in a region (sympatry) may use the same habitat (syntopy) within that region. A central aim in ecology is determining what factors drive species distributions (i.e., abiotic conditions, dispersal limitations, and/or biotic interactions). Assessing the degree of biotic interactions can be difficult for species with wide ranges at sea. This study investigated the spatial ecology of two sea turtle species that forage on benthic invertebrates in neritic GoM waters: Kemp's ridleys (Lepidochelys kempii) and loggerheads (Caretta caretta). We used satellite tracking and modeled behavioral modes, then calculated individual home ranges, compared foraging areas, and determined extent of co-occurrence. Using six environmental variables and principal component analysis, we assessed similarity of chosen foraging sites. We predicted foraging location (eco-region) based on species, nesting site, and turtle size. For 127 turtles (64 Kemp's ridleys, 63 loggerheads) tracked from 1989 to 2013, foraging home ranges were nine to ten times larger for Kemp's ridleys than for loggerheads. Species intersected off all U.S. coasts and the Yucatán Peninsula, but co-occurrence areas were small compared to species' distributions. Kemp's ridley foraging home ranges were concentrated in the northern GoM, whereas those for loggerheads were concentrated in the eastern GoM. The two species were different in all habitat variables compared (latitude, longitude, distance to shore, net primary production, mean sea surface temperature, and bathymetry). Nesting site was the single dominant variable that dictated foraging ecoregion. Although Kemp's ridleys and loggerheads may compete for resources, the separation in foraging areas, significant differences in environmental conditions, and importance of nesting location on ecoregion selection (i.e., dispersal ability) indicate that adult females of these species do not interact greatly during foraging and that dispersal and environmental factors more strongly determine their distributions. These species show sympatry in this region but evidence for syntopy was rare.
Keywords: Caretta caretta; Gulf of Mexico; Lepidochelys kempii; foraging; principal component analysis; satellite tracking; sea turtle; switching state‐space modeling.
Figures


Similar articles
-
Foraging area fidelity for Kemp's ridleys in the Gulf of Mexico.Ecol Evol. 2013 Jul;3(7):2002-12. doi: 10.1002/ece3.594. Epub 2013 May 28. Ecol Evol. 2013. PMID: 23919146 Free PMC article.
-
PHARMACOKINETIC BEHAVIOR OF MELOXICAM IN LOGGERHEAD (CARETTA CARETTA), KEMP'S RIDLEY (LEPIDOCHELYS KEMPII), AND GREEN (CHELONIA MYDAS) SEA TURTLES AFTER SUBCUTANEOUS ADMINISTRATION.J Zoo Wildl Med. 2021 Apr;52(1):295-299. doi: 10.1638/2019-0143. J Zoo Wildl Med. 2021. PMID: 33827188
-
BLOOD FATTY ACID PROFILES OF NERITIC JUVENILE WILD GREEN TURTLES (CHELONIA MYDAS) AND KEMP'S RIDLEYS (LEPIDOCHELYS KEMPII).J Zoo Wildl Med. 2021 Jun;52(2):610-617. doi: 10.1638/2019-0173. J Zoo Wildl Med. 2021. PMID: 34130404
-
Inter-nesting movements and habitat-use of adult female Kemp's ridley turtles in the Gulf of Mexico.PLoS One. 2017 Mar 20;12(3):e0174248. doi: 10.1371/journal.pone.0174248. eCollection 2017. PLoS One. 2017. PMID: 28319178 Free PMC article.
-
The physiology of movement.Mov Ecol. 2020 Feb 4;8:5. doi: 10.1186/s40462-020-0192-2. eCollection 2020. Mov Ecol. 2020. PMID: 32042434 Free PMC article. Review.
Cited by
-
Variations in inter-specific and sex-related niche partitioning in pelagic boobies during their annual cycle.Ecol Evol. 2024 Apr 15;14(4):e11255. doi: 10.1002/ece3.11255. eCollection 2024 Apr. Ecol Evol. 2024. PMID: 38628915 Free PMC article.
-
Loggerhead sea turtle (Caretta caretta) diving changes with productivity, behavioral mode, and sea surface temperature.PLoS One. 2019 Aug 7;14(8):e0220372. doi: 10.1371/journal.pone.0220372. eCollection 2019. PLoS One. 2019. PMID: 31390354 Free PMC article.
-
Drivers of realized satellite tracking duration in marine turtles.Mov Ecol. 2021 Jan 5;9(1):1. doi: 10.1186/s40462-020-00237-3. Mov Ecol. 2021. PMID: 33402218 Free PMC article.
-
Fine-scale intraspecific niche partitioning in a highly mobile, marine megafauna species: implications for ecology and conservation.R Soc Open Sci. 2023 Jun 28;10(6):221529. doi: 10.1098/rsos.221529. eCollection 2023 Jun. R Soc Open Sci. 2023. PMID: 37388320 Free PMC article.
-
Isotopic niche overlap among foraging marine turtle species in the Gulf of Mexico.Ecol Evol. 2023 Nov 28;13(11):e10741. doi: 10.1002/ece3.10741. eCollection 2023 Nov. Ecol Evol. 2023. PMID: 38034330 Free PMC article.
References
-
- Austin, M. P. (2002). Spatial prediction of species distribution: An interface between ecological theory and statistical modeling. Ecological Modeling, 157, 101–118.
-
- Bjorndal, K. A. (1997). Foraging ecology and nutrition of sea turtles In Lutz P. L., & Musick J. A. (Eds.), The biology of sea turtles (Vol. 1, pp. 199–232). Boca Raton, FL: CRC Press.
-
- Bjorndal, K. A. , Schroeder, B. A. , Foley, A. M. , Witherington, B. E. , Bresette, M. , Clark, D. , … Bolten, A. B. (2013). Temporal, spatial, and body size effects on growth rates of loggerhead sea turtles (Caretta caretta) in the Northwest Atlantic. Marine Biology, 160, 2711–2721. 10.1007/s00227-013-2264-y - DOI
LinkOut - more resources
Full Text Sources
