. 2018 Dec 20:5:115.
doi: 10.3389/fmolb.2018.00115. eCollection 2018.

Why the Energy Landscape of Barnase Is Hierarchical

Affiliations

Why the Energy Landscape of Barnase Is Hierarchical

Maya J Pandya et al. Front Mol Biosci. .

Abstract

We have used NMR and computational methods to characterize the dynamics of the ribonuclease barnase over a wide range of timescales in free and inhibitor-bound states. Using temperature- and denaturant-dependent measurements of chemical shift, we show that barnase undergoes frequent and highly populated hinge bending. Using relaxation dispersion, we characterize a slower and less populated motion with a rate of 750 ± 200 s-1, involving residues around the lip of the active site, which occurs in both free and bound states and therefore suggests conformational selection. Normal mode calculations characterize correlated hinge bending motions on a very rapid timescale. These three measurements are combined with previous measurements and molecular dynamics calculations on barnase to characterize its dynamic landscape on timescales from picoseconds to milliseconds and length scales from 0.1 to 2.5 nm. We show that barnase has two different large-scale fluctuations: one on a timescale of 10-9-10-6 s that has no free energy barrier and is a hinge bending that is determined by the architecture of the protein; and one on a timescale of milliseconds (i.e., 750 s-1) that has a significant free energy barrier and starts from a partially hinge-bent conformation. These two motions can be described as hierarchical, in that the more highly populated faster motion provides a platform for the slower (less probable) motion. The implications are discussed. The use of temperature and denaturant is suggested as a simple and general way to characterize motions on the intermediate ns-μs timescale.

Keywords: biophysics; conformational selection; molecular dynamics; nuclear magnetic resonance (NMR); protein dynamics; relaxation dispersion; structural biology.


Figures
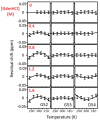
Figure 1
Figure 1
Temperature-dependent chemical shifts of Gly52, Gly53, and Asp54 of barnase H102A at 5° intervals over the range 288–313 K, and at GdmHCl concentrations of 0, 0.4, 0.8, 1.2, and 1.6 M. The data are for the complex of barnase with d(CGAC). Some missing data are due to peak overlap. The linear temperature dependences (which are in the region of −4.5 ppb/degree) have been subtracted to make the curvatures more obvious. The size of the error bars represents the approximate error in measurement of peak position (±0.0075 ppm).
Figure 2
Figure 2
Temperature-dependent curvature for each residue plotted against GdmHCl concentration, for free barnase. Note that zero curvature corresponds to a flat line through zero, near the top of each plot. The data for each residue are fitted to a parabola. For two residues (Val3 and Ile109) the data could not be fitted reliably. Some residues (for example Ala11 and Tyr78) have a markedly curved fit, but the scatter in the data means that the fitted curve is not significantly different from zero (see section Materials and Methods). Other residues (for example Asn5 and Phe7) have fits that are close to zero, but on testing turn out to be significantly different from zero.
Figure 3
Figure 3
Temperature-dependent curvature for each residue plotted against GdmHCl concentration, for the complex of barnase with d(CGAC). See legend for Figure 2 for other details.
Figure 4
Figure 4
Relaxation dispersion profiles for free barnase at 298 K. Data are shown for the six residues showing the largest measurable effects. Five other residues (36, 39, 43, 56, and 58) also have clear profiles at both fields, but smaller than those shown here, while L14 is clearly exchanging but could not be measured accurately because of overlap. These residues are shown on the protein structure in Figure 9 below. Experimental data are represented by red and blue circles at 600 and 800 MHz, respectively. Errors in measured relaxation rates are ~0.7 s−1 at 600 MHz and 1.4 s−1 at 800 MHz.
Figure 5
Figure 5
Estimation of forward rate for free barnase. The data shown in Figure 4 at both field strengths were fitted to common forward and back rates (or equivalently, a common global exchange rate and population ratio), with residue-specific values for the 15N chemical shift differences. The best fit was 750 ± 200 s−1 for the global exchange rate (indicated by the dashed horizontal line in the bottom panel), with a forward rate of 10 s−1 (vertical dashed line, bottom panel). As an alternative approach, the forward rate was fixed to various values, and the data were then re-fitted (bottom panel, filled circles). The quality of the fit is indicated by the χ2 values shown in the upper panel, which have a minimum at the same forward rate of 10 s−1, demonstrating the consistency between the two approaches.
Figure 6
Figure 6
Comparison of chemical shift changes calculated from fitting to relaxation dispersion data for free barnase [expressed as (pApBΔω2)1/2], with chemical shift changes observed on adding d(CGAC) to barnase. The error in the binding shift change of Arg83 (in the center of the plot) is ~1 ppm because it is expected to hydrogen bond to nucleotide in the bound state (Buckle and Fersht, 1994), which leads to large and rather unpredictable shift changes (Xu and Case, 2002). The residues used for the fitting are those shown in Figure 4.
Figure 7
Figure 7
Relaxation dispersion data for barnase bound to d(CGAC) at 298 K. Data are shown for the seven residues showing the largest effects at 600 MHz. Experimental data are represented by the circles, with errors of ±0.5 Hz. Data were fitted to a global forward and backward rate, with individual chemical shift differences fixed at the changes observed experimentally between bound and free, corrected for ring current shifts.
Figure 8
Figure 8
Comparison of the experimental 15N chemical shift changes on binding of barnase to d(CGAC) for (L to R) residues 14, 39, 106, 73, 102, 56, and 85, with the chemical shift change obtained by fitting to the relaxation dispersion data for bound barnase. The fit was carried out by fixing the global exchange rate to 500 s−1, requiring all residues to have the same forward and back rates, and leaving all other parameters free. The fitted forward rate was 4 s−1, as described in the text. The overall correlation coefficient R2 is 0.62. The errors shown on the fitted shift changes are obtained from the fitting process, and the line has a gradient of 1.
Figure 9
Figure 9
Residues identified as being involved in concerted motions, illustrated using the crystal structure 1brn. Helices are residues 6–18, 26–34, and 41–46, and sheets are residues 51–56, 70–76, 86–92, and 108–109. (A) Residues identified as being the major mobile elements in MD/normal mode analysis: 24–25, 50–55, 71–75, and 87–91 (Zhuravleva et al., 2007). The region in orange [87–91] was also identified in an independent analysis of conformational ensembles (Hilser et al., 1998). (B) Residues identified in this work from Gdm curvature: 5, 7, 27, 28, 30, 51–54, 60, 71–74, 85, and 100–102. (C) Residues previously identified from high-pressure NMR to be involved in sub-μs fluctuations: 23, 26, 28, 34, 40, 44, 50, 53, 55, 75, 87, 89, 93, 97, and 107 (Wilton et al., 2009). (D) Residues identified in this work from relaxation dispersion analysis: 36, 39, 42, 43, 56, 58, 83, 85, 86, 101, and 106. (E) Residues identified as having large changes in chemical shift and/or methyl group dynamics on binding to barstar: 24, 27, 37, 41, 51, 58–60, 82–86, and 101–104 (Zhuravleva et al., 2007). Shown here for reference is the location of the central two residues of bound d(CGAC) in magenta.
Figure 10
Figure 10
Superposition of 8 structures from the lowest energy normal mode of barnase, corresponding to a 0.5 Å average RMSD, from green (crystal structure) to orange. (A) Free barnase (PDB 1a2p). (B) Free barnase H102A (PDB 1a2p with the H102 sidechain truncated to CB). (C) Bound barnase (PDB 1brn). The next three normal modes look very similar.
Figure 11
Figure 11
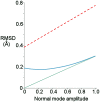
Root-mean-square distance (RMSD) from given starting structure to different points on the lowest energy normal mode trajectory of free barnase, produced using the crystal structure of free barnase (1a2p) as the starting structure. A normal mode amplitude of 1 corresponds to an all-atom RMSD of 0.24 Å. Green: RMSD from 1a2p. Red: RMSD from the closed structure bound to d(CGAC), 1brn. Blue: RMSD from 1brn, but calculated using only Cβ atoms of the residues involved in lip closure (42, 56, 83, 85, 86, 101, and 106).
Figure 12
Figure 12
Relationship between the two fluctuations discussed here. Hinge bending has no free energy barrier to fluctuation: higher energy states merely occupy a larger conformational space. By contrast, lip closure passes over a high-energy transition state. The two pathways overlap at position X.

References

    1. Agarwal P. K. (2006). Enzymes: an integrated view of structure, dynamics and function. Microb. Cell Fact. 5:2. 10.1186/1475-2859-5-2 - DOI - PMC - PubMed
    1. Agarwal P. K., Billeter S. R., Rajagopalan P. T. R., Benkovic S. J., Hammes-Schiffer S. (2002). Network of coupled promoting motions in enzyme catalysis. Proc. Natl. Acad. Sci. U.S.A. 99, 2794–2799. 10.1073/pnas.052005999 - DOI - PMC - PubMed
    1. Aleksandrov A., Simonson T. (2010). Molecular dynamics simulations show that conformational selection governs the binding preferences of imatinib for several tyrosine kinases. J. Biol. Chem. 285, 13807–13815. 10.1074/jbc.M110.109660 - DOI - PMC - PubMed
    1. Alexandrov V., Lehnert U., Echols N., Milburn D., Engelman D., Gerstein M. (2005). Normal modes for predicting protein motions: a comprehensive database assessment and associated Web tool. Protein Sci. 14, 633–643. 10.1110/ps.04882105 - DOI - PMC - PubMed
    1. Antoniou D., Schwartz S. D. (2011). Protein dynamics and enzymatic chemical barrier passage. J. Phys. Chem. B 115, 15147–15158. 10.1021/jp207876k - DOI - PMC - PubMed