

Structure in talker variability: How much is there and how much can it help?
- PMID: 30619905
- PMCID: PMC6320234
- DOI: 10.1080/23273798.2018.1500698
Structure in talker variability: How much is there and how much can it help?
Abstract
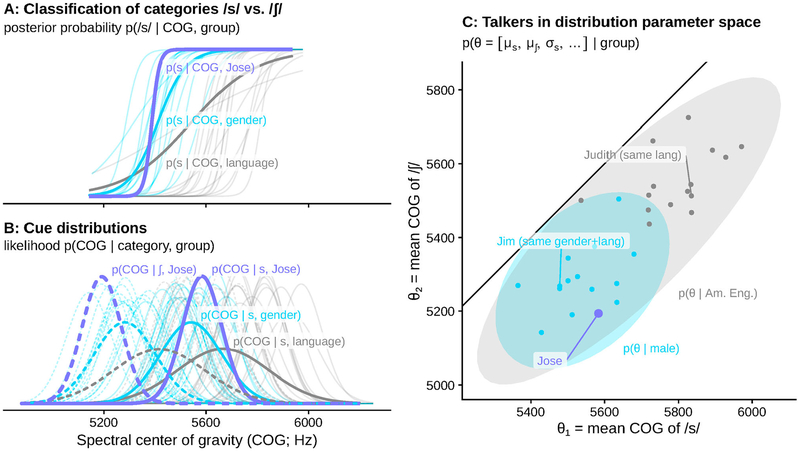
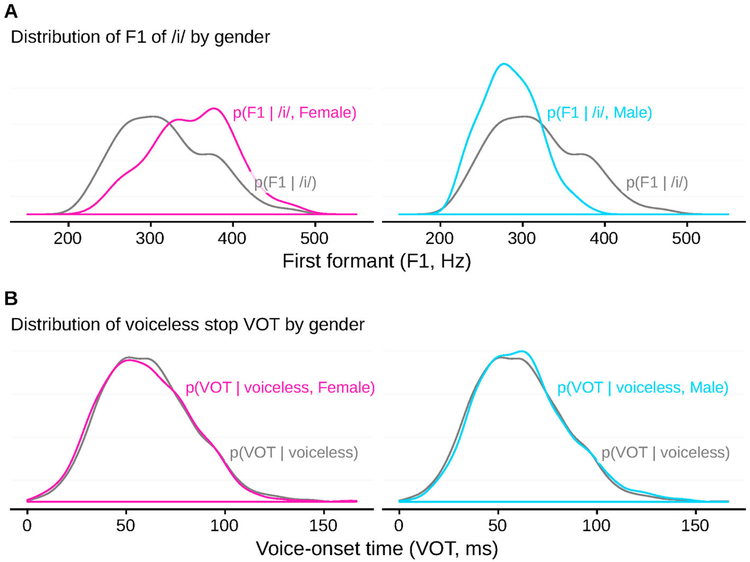
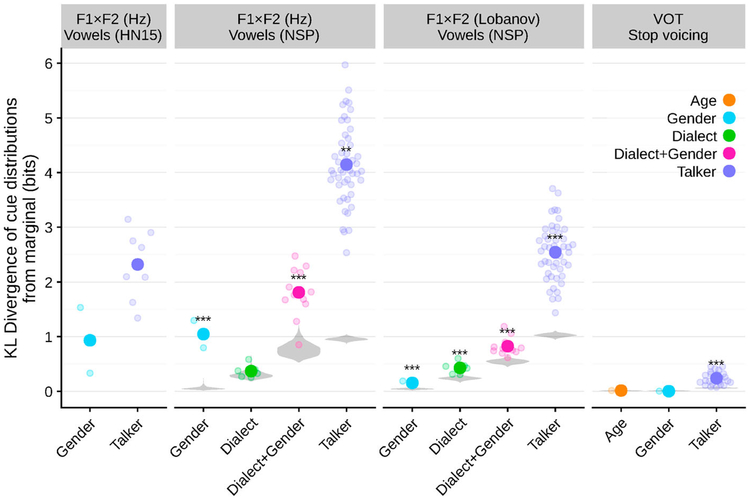
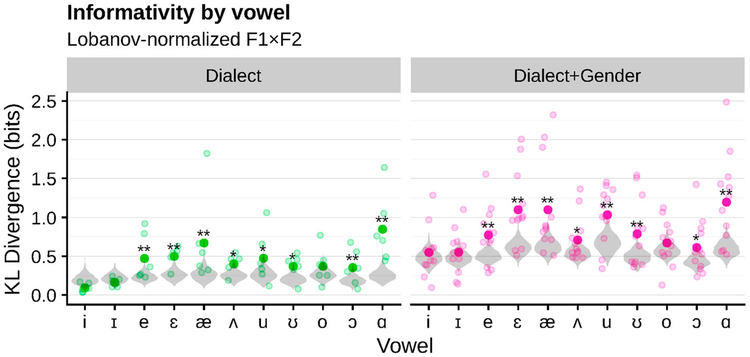
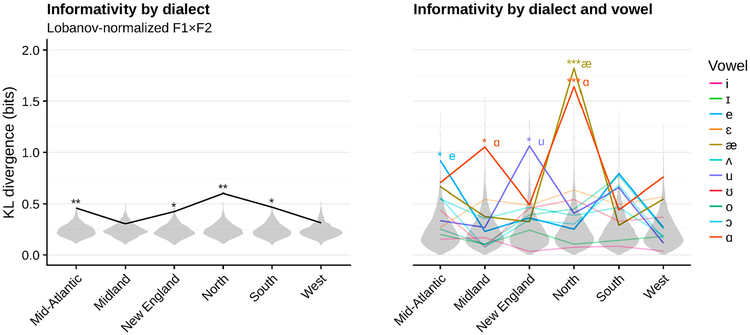
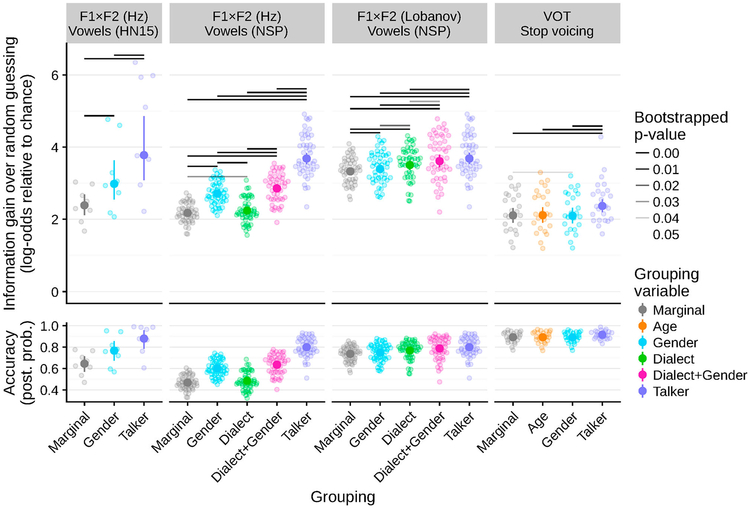
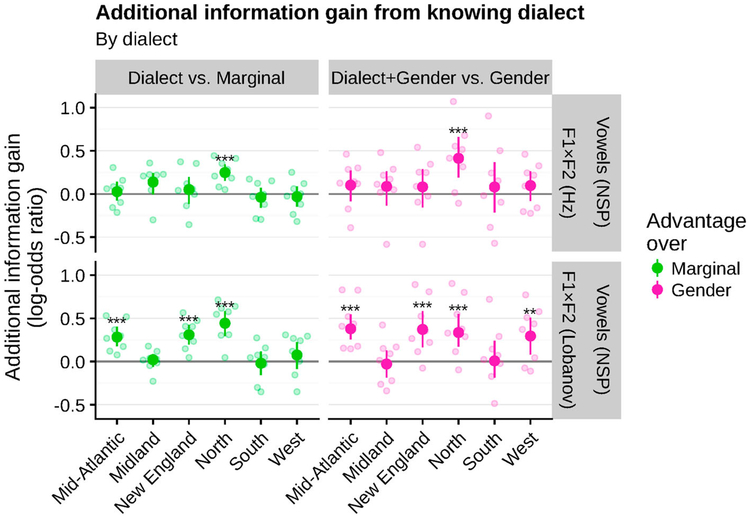
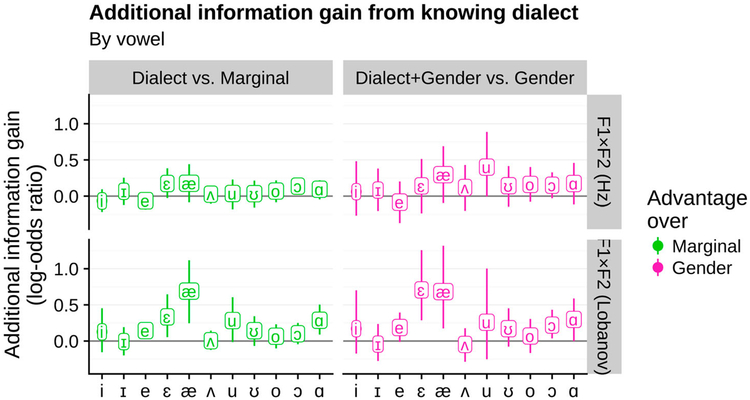
One of the persistent puzzles in understanding human speech perception is how listeners cope with talker variability. One thing that might help listeners is structure in talker variability: rather than varying randomly, talkers of the same gender, dialect, age, etc. tend to produce language in similar ways. Listeners are sensitive to this covariation between linguistic variation and socio-indexical variables. In this paper I present new techniques based on ideal observer models to quantify (1) the amount and type of structure in talker variation (informativity of a grouping variable), and (2) how useful such structure can be for robust speech recognition in the face of talker variability (the utility of a grouping variable). I demonstrate these techniques in two phonetic domains-word-initial stop voicing and vowel identity-and show that these domains have different amounts and types of talker variability, consistent with previous, impressionistic findings. An R package (phondisttools) accompanies this paper, and the source and data are available from osf.io/zv6e3.
Keywords: Speech perception; computational modelling; variability.
Conflict of interest statement
Disclosure statement No potential conflict of interest was reported by the authors.
Figures
Similar articles
-
Speech perception in children with cochlear implants: effects of lexical difficulty, talker variability, and word length.Ann Otol Rhinol Laryngol Suppl. 2000 Dec;185:79-81. doi: 10.1177/0003489400109s1234. Ann Otol Rhinol Laryngol Suppl. 2000. PMID: 11141016
-
Talker familiarity and the accommodation of talker variability.Atten Percept Psychophys. 2021 May;83(4):1842-1860. doi: 10.3758/s13414-020-02203-y. Epub 2021 Jan 4. Atten Percept Psychophys. 2021. PMID: 33398658
-
Non-native listeners' recognition of high-variability speech using PRESTO.J Am Acad Audiol. 2014 Oct;25(9):869-92. doi: 10.3766/jaaa.25.9.9. J Am Acad Audiol. 2014. PMID: 25405842 Free PMC article.
-
The effects of indexical and phonetic variation on vowel perception in typically developing 9- to 12-year-old children.J Speech Lang Hear Res. 2014 Apr 1;57(2):389-405. doi: 10.1044/2014_JSLHR-S-12-0248. J Speech Lang Hear Res. 2014. PMID: 24686520 Free PMC article.
-
Representation of speech variability.Wiley Interdiscip Rev Cogn Sci. 2017 Jul;8(4). doi: 10.1002/wcs.1434. Epub 2017 Feb 3. Wiley Interdiscip Rev Cogn Sci. 2017. PMID: 28160440 Review.
Cited by
-
Computational Modeling of an Auditory Lexical Decision Experiment Using DIANA.Lang Speech. 2023 Sep;66(3):564-605. doi: 10.1177/00238309221111752. Epub 2022 Aug 24. Lang Speech. 2023. PMID: 36000386 Free PMC article.
-
Reliability and validity for perceptual flexibility in speech.Brain Lang. 2022 Mar;226:105070. doi: 10.1016/j.bandl.2021.105070. Epub 2022 Jan 10. Brain Lang. 2022. PMID: 35026449 Free PMC article.
-
Time and information in perceptual adaptation to speech.Cognition. 2019 Nov;192:103982. doi: 10.1016/j.cognition.2019.05.019. Epub 2019 Jun 21. Cognition. 2019. PMID: 31229740 Free PMC article.
-
Toward "English" Phonetics: Variability in the Pre-consonantal Voicing Effect Across English Dialects and Speakers.Front Artif Intell. 2020 May 29;3:38. doi: 10.3389/frai.2020.00038. eCollection 2020. Front Artif Intell. 2020. PMID: 33733155 Free PMC article.
-
Gender stereotypes and social perception of vocal confidence is mitigated by salience of socio-indexical cues to gender.Front Psychol. 2023 Dec 14;14:1125164. doi: 10.3389/fpsyg.2023.1125164. eCollection 2023. Front Psychol. 2023. PMID: 38155698 Free PMC article.
References
-
- Allaire J, Xie Y, McPherson J, Luraschi J, Ushey K, Atkins A, & Chang W (2017). Rmarkdown: Dynamic documents for r. R package version 1.7. Retrieved from https://CRAN.R-project.org/package=rmarkdown.
-
- Benjamini Y, & Hochberg Y (1995). Controlling the false discovery rate: A practical and powerful approach to multiple testing. Journal of the Royal Statistical Society. Series B (Methodological), 57(1), 289–300. JSTOR: 2346101
Grants and funding
LinkOut - more resources
Full Text Sources
Other Literature Sources