

Inhibition of Triggering Receptor Expressed on Myeloid Cells 1 Ameliorates Inflammation and Macrophage and Neutrophil Activation in Alcoholic Liver Disease in Mice
- PMID: 30619998
- PMCID: PMC6312652
- DOI: 10.1002/hep4.1269
Inhibition of Triggering Receptor Expressed on Myeloid Cells 1 Ameliorates Inflammation and Macrophage and Neutrophil Activation in Alcoholic Liver Disease in Mice
Abstract
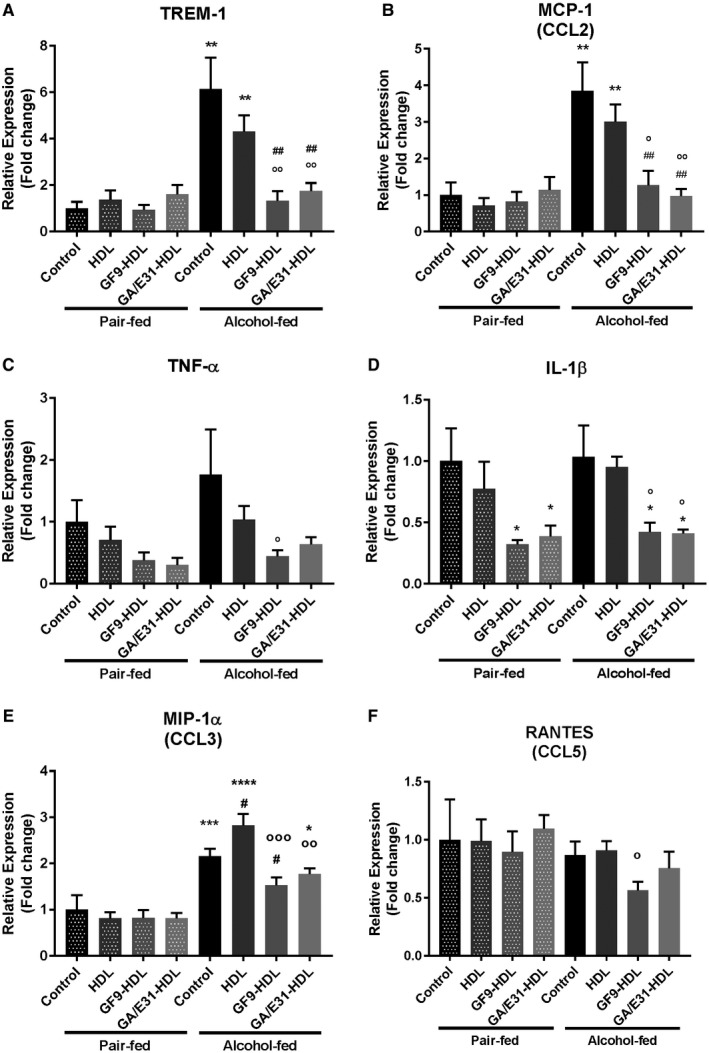
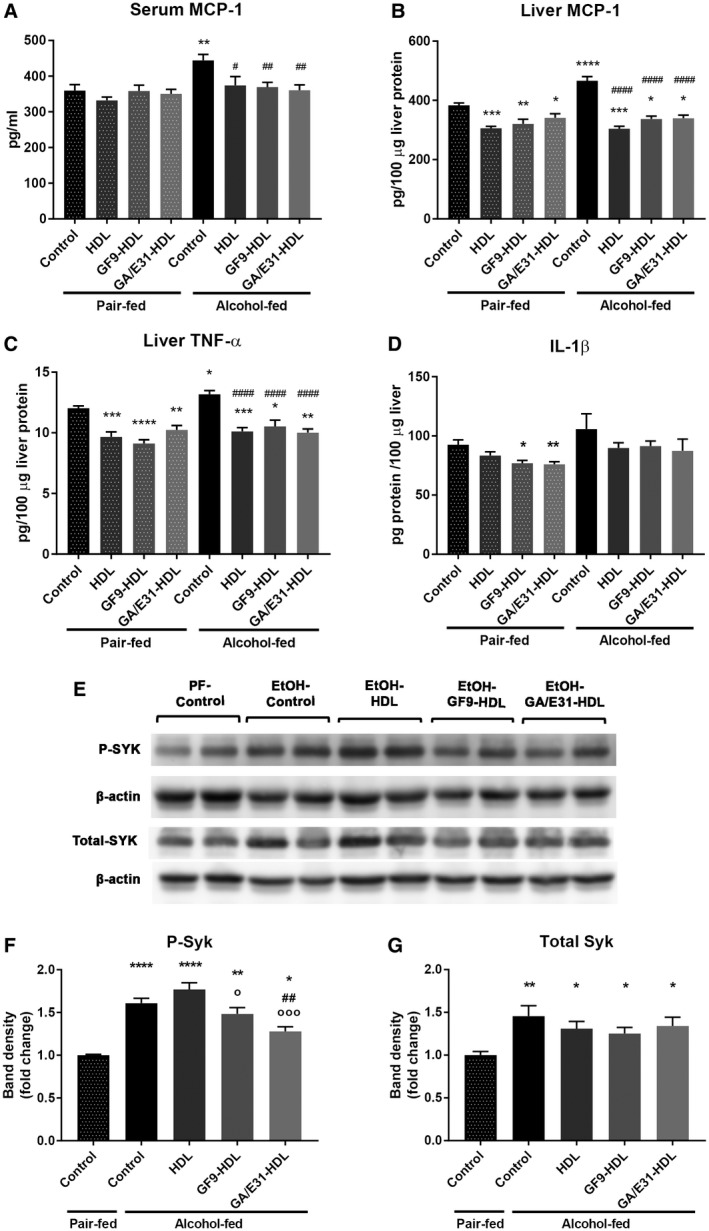
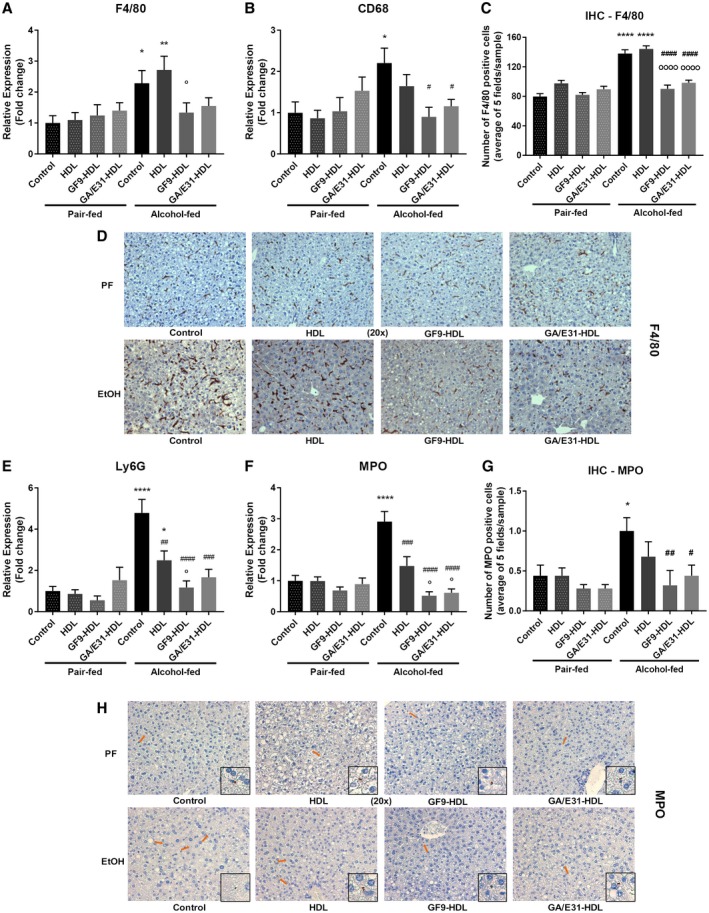
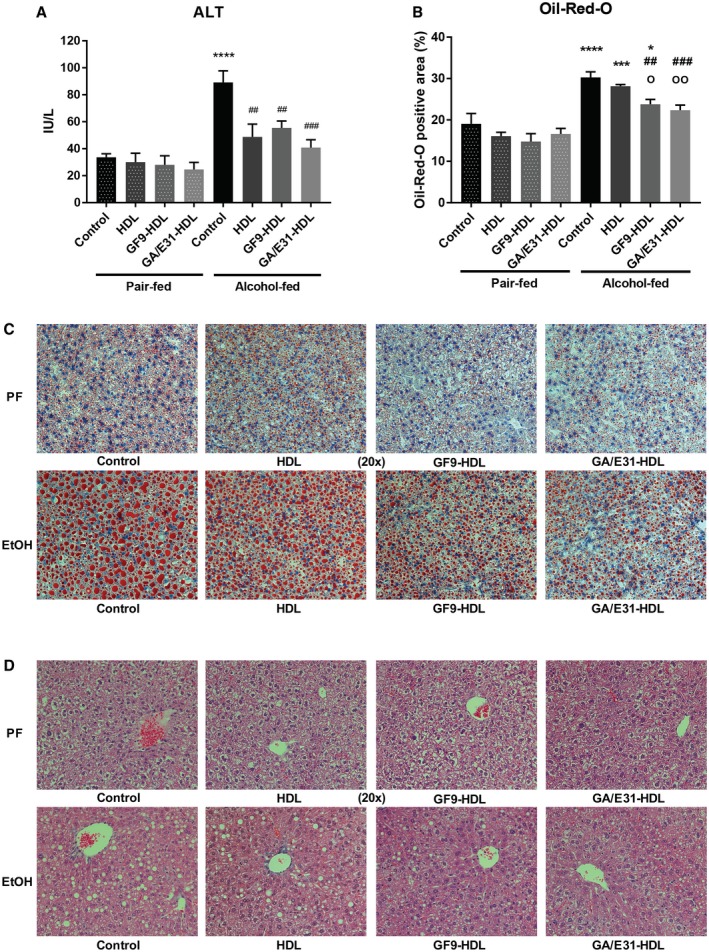
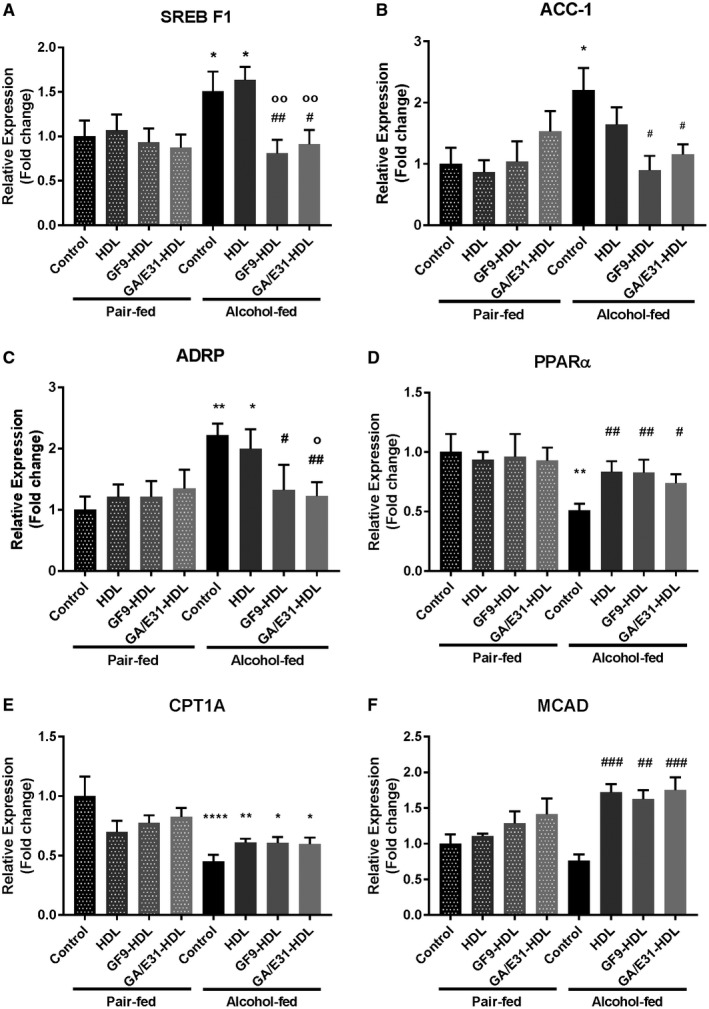
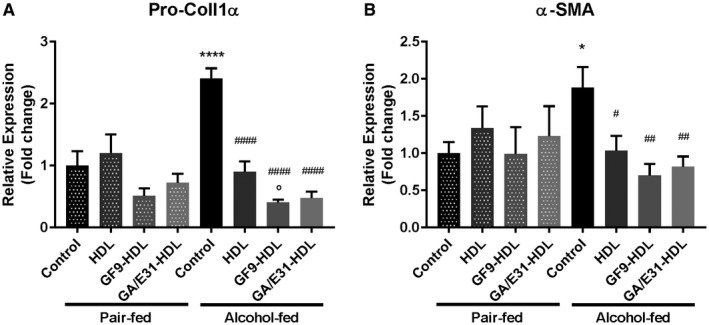
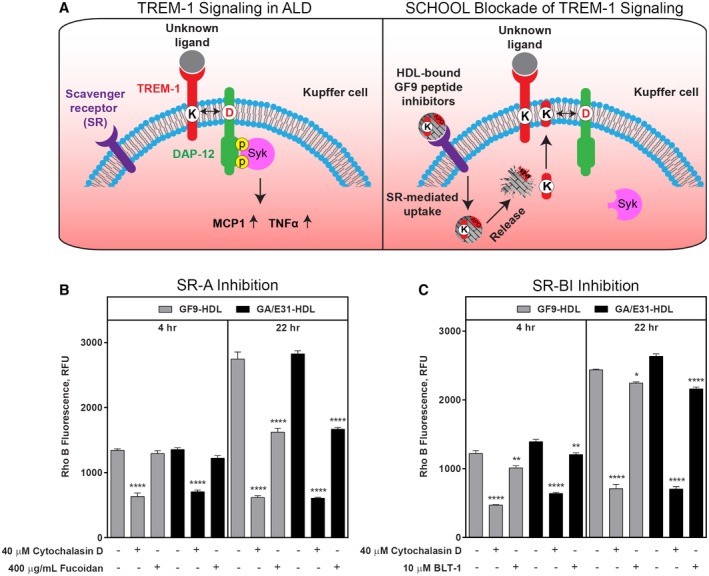
Alcoholic liver disease (ALD) is characterized by macrophage and neutrophil leukocyte recruitment and activation in the liver. Damage- and pathogen-associated molecular patterns contribute to a self-perpetuating proinflammatory state in ALD. Triggering receptor expressed on myeloid cells 1 (TREM-1) is a surface receptor that amplifies inflammation induced by toll-like receptors (TLRs) and is expressed on neutrophils and monocytes/macrophages. We hypothesized that TREM-1 signaling contributes to proinflammatory pathway activation in ALD. Using an in vivo ALD model in mice, we tested the effects of ligand-independent TREM-1 inhibitory peptides that were formulated into human high-density lipoprotein (HDL)-mimicking complexes GF9-HDL and GA/E31-HDL. As revealed in vitro, macrophages endocytosed these rationally designed complexes through scavenger receptors. A 5-week alcohol feeding with the Lieber-DeCarli diet in mice resulted in increased serum alanine aminotransferase (ALT), liver steatosis, and increased proinflammatory cytokines in the liver. TREM-1 messenger RNA (mRNA) expression was significantly increased in alcohol-fed mice, and TREM-1 inhibitors significantly reduced this increase. TREM-1 inhibition significantly attenuated alcohol-induced spleen tyrosine kinase (SYK) activation, an early event in both TLR4 and TREM-1 signaling. The TREM-1 inhibitors significantly inhibited macrophage (epidermal growth factor-like module-containing mucin-like hormone receptor-like 1 [F4/80], clusters of differentiation [CD]68) and neutrophil (lymphocyte antigen 6 complex, locus G [Ly6G] and myeloperoxidase [MPO]) markers and proinflammatory cytokines (monocyte chemoattractant protein 1 [MCP-1], tumor necrosis factor α [TNF-α], interleukin-1β [IL-1β], macrophage inflammatory protein 1α [MIP-1α]) at the mRNA level compared to the HDL vehicle. Administration of TREM-1 inhibitors ameliorated liver steatosis and early fibrosis markers (α-smooth muscle actin [αSMA] and procollagen1α [Pro-Col1α]) at the mRNA level in alcohol-fed mice. However, the HDL vehicle also reduced serum ALT and some cytokine protein levels in alcohol-fed mice, indicating HDL-related effects. Conclusion: HDL-delivered novel TREM-1 peptide inhibitors ameliorate early phases of inflammation and neutrophil and macrophage recruitment and activation in the liver and attenuate hepatocyte damage and liver steatosis. TREM-1 inhibition represents a promising therapeutic approach for further investigations in ALD.
Figures
Similar articles
-
Rationally designed ligand-independent peptide inhibitors of TREM-1 ameliorate collagen-induced arthritis.J Cell Mol Med. 2017 Oct;21(10):2524-2534. doi: 10.1111/jcmm.13173. Epub 2017 Apr 6. J Cell Mol Med. 2017. PMID: 28382703 Free PMC article.
-
Pharmacological Inhibition of CCR2/5 Signaling Prevents and Reverses Alcohol-Induced Liver Damage, Steatosis, and Inflammation in Mice.Hepatology. 2019 Mar;69(3):1105-1121. doi: 10.1002/hep.30249. Epub 2019 Feb 12. Hepatology. 2019. PMID: 30179264 Free PMC article.
-
Adult mouse model of early hepatocellular carcinoma promoted by alcoholic liver disease.World J Gastroenterol. 2016 Apr 28;22(16):4091-108. doi: 10.3748/wjg.v22.i16.4091. World J Gastroenterol. 2016. PMID: 27122661 Free PMC article.
-
IL-1 receptor antagonist ameliorates inflammasome-dependent alcoholic steatohepatitis in mice.J Clin Invest. 2012 Oct;122(10):3476-89. doi: 10.1172/JCI60777. Epub 2012 Sep 4. J Clin Invest. 2012. PMID: 22945633 Free PMC article. Review.
-
n-3 Polyunsaturated fatty acids for the management of alcoholic liver disease: A critical review.Crit Rev Food Sci Nutr. 2019;59(sup1):S116-S129. doi: 10.1080/10408398.2018.1544542. Epub 2018 Dec 22. Crit Rev Food Sci Nutr. 2019. PMID: 30580553 Review.
Cited by
-
Morin Hydrate Inhibits TREM-1/TLR4-Mediated Inflammatory Response in Macrophages and Protects Against Carbon Tetrachloride-Induced Acute Liver Injury in Mice.Front Pharmacol. 2019 Sep 20;10:1089. doi: 10.3389/fphar.2019.01089. eCollection 2019. Front Pharmacol. 2019. PMID: 31616301 Free PMC article.
-
The spleen tyrosine kinase (SYK): A crucial therapeutic target for diverse liver diseases.Heliyon. 2022 Dec 7;8(12):e12130. doi: 10.1016/j.heliyon.2022.e12130. eCollection 2022 Dec. Heliyon. 2022. PMID: 36568669 Free PMC article. Review.
-
Inhibition of TREM-2 Markedly Suppresses Joint Inflammation and Damage in Experimental Arthritis.Int J Mol Sci. 2022 Aug 9;23(16):8857. doi: 10.3390/ijms23168857. Int J Mol Sci. 2022. PMID: 36012120 Free PMC article.
-
The Gut-Liver Axis in Chronic Liver Disease: A Macrophage Perspective.Cells. 2021 Oct 30;10(11):2959. doi: 10.3390/cells10112959. Cells. 2021. PMID: 34831182 Free PMC article. Review.
-
Role of immune cell interactions in alcohol-associated liver diseases.Liver Res. 2024 Jun 10;8(2):72-82. doi: 10.1016/j.livres.2024.06.002. eCollection 2024 Jun. Liver Res. 2024. PMID: 39959875 Free PMC article. Review.
References
-
- Bautista AP. Neutrophilic infiltration in alcoholic hepatitis. Alcohol 2002;27:17‐21. - PubMed
-
- Tessarz AS, Cerwenka A. The TREM‐1/DAP12 pathway. Immunol Lett 2008;116:111‐116. - PubMed
-
- Arts RJ, Joosten LA, Dinarello CA, Kullberg BJ, van der Meer JW, Netea MG. TREM‐1 interaction with the LPS/TLR4 receptor complex. Eur Cytokine Netw 2011;22:11‐14. - PubMed
Grants and funding
LinkOut - more resources
Full Text Sources
Other Literature Sources
Research Materials
Miscellaneous
