. 2018 Dec 4;3(1):147-159.
doi: 10.1002/hep4.1274. eCollection 2019 Jan.

Constitutive Androstane Receptor Differentially Regulates Bile Acid Homeostasis in Mouse Models of Intrahepatic Cholestasis

Affiliations

Constitutive Androstane Receptor Differentially Regulates Bile Acid Homeostasis in Mouse Models of Intrahepatic Cholestasis

Kang Ho Kim et al. Hepatol Commun. .

Abstract

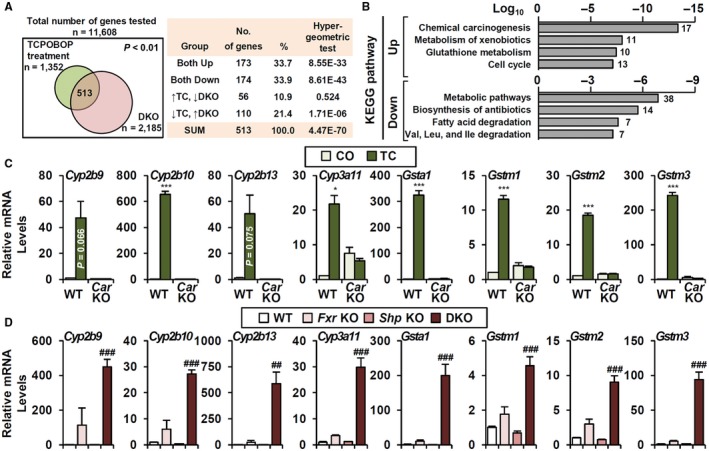
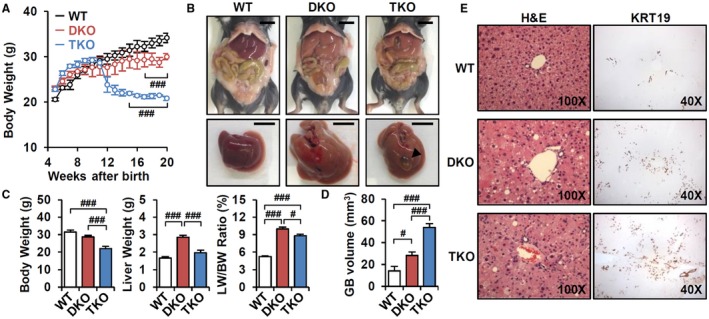
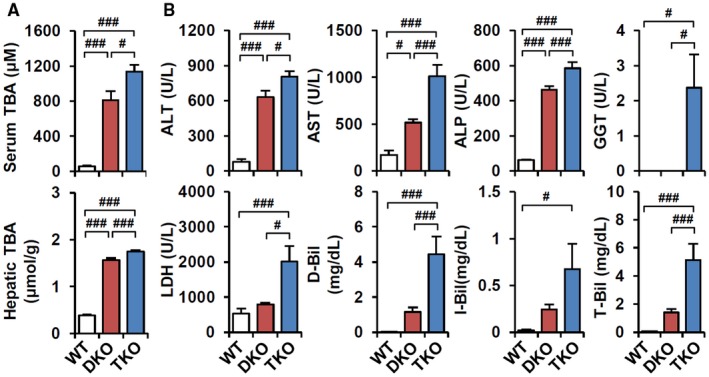
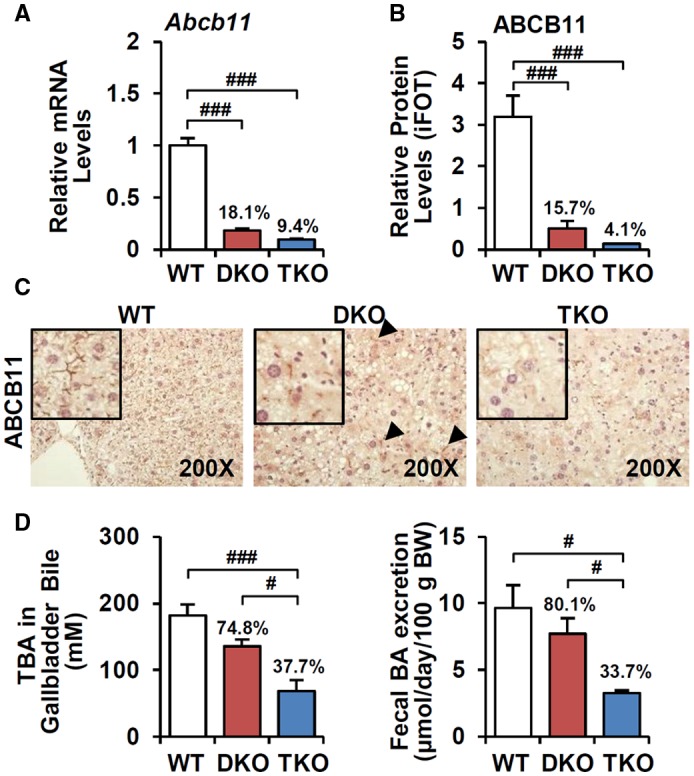
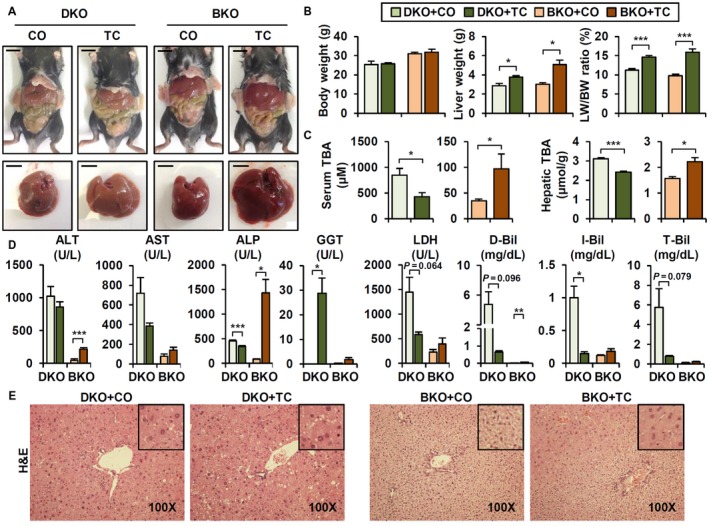
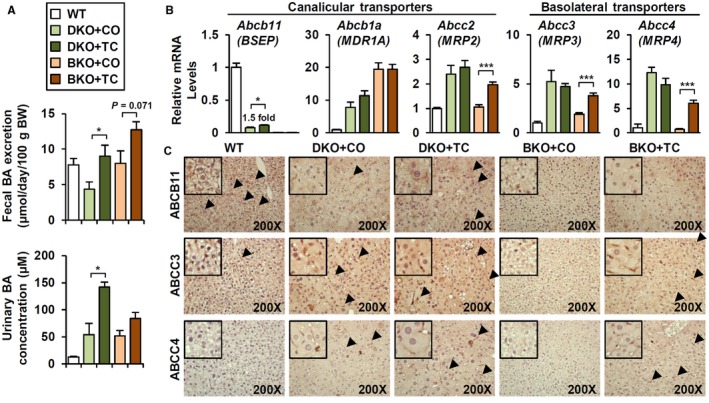
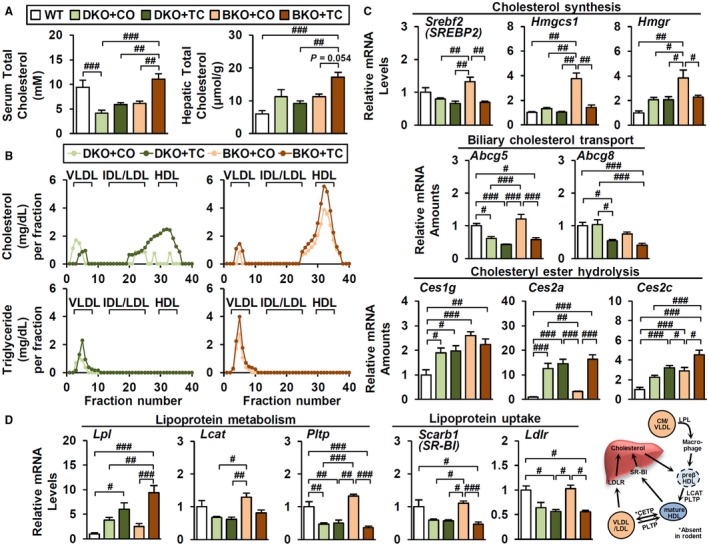
Bile acid (BA) homeostasis is tightly regulated by multiple transcription factors, including farnesoid X receptor (FXR) and small heterodimer partner (SHP). We previously reported that loss of the FXR/SHP axis causes severe intrahepatic cholestasis, similar to human progressive familial intrahepatic cholestasis type 5 (PFIC5). In this study, we found that constitutive androstane receptor (CAR) is endogenously activated in Fxr:Shp double knockout (DKO) mice. To test the hypothesis that CAR activation protects DKO mice from further liver damage, we generated Fxr;Shp;Car triple knockout (TKO) mice. In TKO mice, residual adenosine triphosphate (ATP) binding cassette, subfamily B member 11 (ABCB11; alias bile salt export pump [BSEP]) function and fecal BA excretion are completely impaired, resulting in severe hepatic and biliary damage due to excess BA overload. In addition, we discovered that pharmacologic CAR activation has different effects on intrahepatic cholestasis of different etiologies. In DKO mice, CAR agonist 1,4-bis[2-(3,5-dichloropyridyloxy)]benzene (TCPOBOP; here on TC) treatment attenuated cholestatic liver injury, as expected. However, in the PFIC2 model Bsep knockout (BKO) mice, TC treatment exhibited opposite effects that reflect increased BA accumulation and liver injury. These contrasting results may be linked to differential regulation of systemic cholesterol homeostasis in DKO and BKO livers. TC treatment selectively up-regulated hepatic cholesterol levels in BKO mice, supporting de novo BA synthesis. Conclusion: CAR activation in DKO mice is generally protective against cholestatic liver injury in these mice, which model PFIC5, but not in the PFIC2 model BKO mice. Our results emphasize the importance of the genetic and physiologic background when implementing targeted therapies to treat intrahepatic cholestasis.


Figures

Figure 1
Figure 1
DKO gene signature indicates potential CAR activation. (A) Comparison of DKO and TC‐treated liver microarrays. Among 513 genes that were significantly changed in both microarrays, 347 genes (173 + 174, 67.6%) were regulated in the same manner. (B) KEGG pathway analysis of 347 genes; the top four gene categories in each analysis are shown. (C,D) Representative CYP and GST gene expressions (C) by TC treatment in WT and Car knockout (n = 4) as well as (D) in Fxr knockout, Shp knockout, and DKO (n = 3‐6). Student t test, *P < 0.05, ***P < 0.005 compared to CO‐treated WT. ANOVA followed by Tukey HSD; ##P < 0.01, ###P < 0.005. In some cases, the actual P value is presented.
Figure 2
Figure 2
Loss of CAR accelerates cholestatic liver injury. (A) BW changes of WT, DKO, and TKO mice (n = 3‐5). (B) Representative image of whole body and liver at 3 months old. Scale bar, 10 mm; arrowhead, cholecystomegaly. (C) BW, liver weight, liver/BW ratio (%) (n = 8), and (D) gallbladder volume (n = 5) were measured. (E) Hematoxylin and eosin staining (magnification ×100) and KRT19 immunostaining (magnification ×40). ANOVA followed by Tukey HSD; #P < 0.05, ###P < 0.005. Abbreviations: GB, gallbladder; H&E, hematoxylin and eosin; LW, liver weight.
Figure 3
Figure 3
TKO increases BA‐induced liver toxicity. (A) Total BA levels in serum and liver (n = 6‐8). (B) Serum biochemistry analysis (n = 8). ANOVA followed by Tukey HSD; #P < 0.05, ###P < 0.005. Abbreviations: ALP, alkaline phosphatase; D‐Bil, direct bilirubin; I‐Bil, indirect bilirubin; LDH, lactate dehydrogenase; T‐Bil, total bilirubin.
Figure 4
Figure 4
TKO further attenuates ABCB11‐mediated fecal BA excretion. (A) mRNA (n = 8) and (B) protein levels (n = 3) of ABCB11 were analyzed by q‐PCR and proteomics, respectively. Ratio (%) indicates the proportion of ABCB11 expressions compared to WT. (C) Immunostaining of ABCB11 (magnification ×200); arrowhead, residual canalicular ABCB11 expression. (D) BA levels in gallbladder‐collected bile (n = 4) and feces (n = 3). ANOVA followed by Tukey HSD, #P < 0.05, ###P < 0.005. Abbreviation: iFOT, intensity‐based fraction of total.
Figure 5
Figure 5
CAR activation has differential effects in DKO and BKO. (A) Representative whole body and liver image. Scale bar, 10 mm. (B) BW, liver weight, and liver/BW ratio (n = 4). (C) Serum and hepatic TBA levels (n = 4). (D) Serum biochemistry (n = 4). (E) Hematoxylin and eosin staining (magnification ×100). Student t test; *P < 0.05, **P < 0.01, ***P < 0.005 compared to CO‐treated group. In some cases, actual P value is presented. Abbreviations: ALP, alkaline phosphatase; D‐Bil, direct bilirubin; I‐Bil, indirect bilirubin; LDH, lactate dehydrogenase; LW, liver weight; T‐Bil, total bilirubin.
Figure 6
Figure 6
TC treatment enhances canalicular and basolateral BA transporters. (A) Fecal BA excretion (n = 4) and urinary BA concentration (n = 3) in TC‐treated (1 week) DKO and BKO. (B) mRNA levels of BA transporters (n = 4). (C) Immunostaining of ABCB11, ABCC3, and ABCC4 (magnification ×200). Arrowhead, positive area. Student t test; *P < 0.05, ***P < 0.005 compared to CO‐treated group. Abbreviation: MDR, multidrug resistance.
Figure 7
Figure 7
TC differentially controls cholesterol homeostasis in DKO and BKO. (A) Total cholesterol levels in serum and liver (n = 4). (B) Cholesterol (upper) and triglyceride (lower) concentration in lipoprotein fractions. Gene expression profiles involved in (C) cholesterol and (D) lipoprotein metabolism (n = 4). ANOVA followed by Tukey HSD; #P < 0.05, ##P < 0.01, ###P < 0.005. Abbreviations: CETP, cholesteryl ester transfer protein; CM, chylomicrons; Hmgcs1, 3‐hydroxy‐3‐methylglutaryl–coenzyme A synthase 1; Hmgr 3‐hydroxy‐3‐methylglutaryl–coenzyme A reductase; IDL, intermediate density lipoprotein; Ldlr, low‐density lipoprotein receptor; Scarb1, scavenger receptor class B, member 1; VLDL, very low density lipoprotein.

References

    1. Trauner M, Claudel T, Fickert P, Moustafa T, Wagner M. Bile acids as regulators of hepatic lipid and glucose metabolism. Dig Dis 2010;28:220‐224. - PubMed
    1. Chiang JY. Bile acid regulation of gene expression: Roles of nuclear hormone receptors. Endocr Rev 2002;23:443‐463. - PubMed
    1. Molinaro A, Wahlstrom A, Marschall HU. Role of bile acids in metabolic control. Trends Endocrinol Metab 2018;29:31‐41. - PubMed
    1. Balistreri WF, Bezerra JA, Jansen P, Karpen SJ, Shneider BL, Suchy FJ. Intrahepatic cholestasis: summary of an American Association for the Study of Liver Diseases single‐topic conference. Hepatology 2005;42:222‐235. - PubMed
    1. Schady DA, Finegold MJ. Contemporary evaluation of the pediatric liver biopsy. Gastroenterol Clin North Am 2017;46:233‐252. - PubMed