. 2018 Dec 28;2(1):e201800115.
doi: 10.26508/lsa.201800115. eCollection 2019 Feb.

Optimized ChIP-seq method facilitates transcription factor profiling in human tumors

Affiliations

Optimized ChIP-seq method facilitates transcription factor profiling in human tumors

Abhishek A Singh et al. Life Sci Alliance. .

Abstract

Chromatin immunoprecipitation (ChIP)-seq analyses of transcription factors in clinical specimens are challenging due to the technical limitations and low quantities of starting material, often resulting in low enrichments and poor signal-to-noise ratio. Here, we present an optimized protocol for transcription factor ChIP-seq analyses in human tissue, yielding an ∼100% success rate for all transcription factors analyzed. As proof of concept and to illustrate general applicability of the approach, human tissue from the breast, prostate, and endometrial cancers were analyzed. In addition to standard formaldehyde fixation, disuccinimidyl glutarate was included in the procedure, greatly increasing data quality. To illustrate the sensitivity of the optimized protocol, we provide high-quality ChIP-seq data for three independent factors (AR, FOXA1, and H3K27ac) from a single core needle prostate cancer biopsy specimen. In summary, double-cross-linking strongly improved transcription factor ChIP-seq quality on human tumor samples, further facilitating and enhancing translational research on limited amounts of tissue.


Conflict of interest statement

The authors declare that they have no conflict of interest.

Figures

Figure S1.
Figure S1.. Chromatin shearing is not affected between the two fixation methods.
(A) Agarose gel electrophoresis (2%) for MCF-7 (left) and LNCaP (right). Between FA only and FA combined with DSG (FA+DSG), no clear differences in DNA fragment size were observed. (B) Bioanalyzerblots for a breast cancer and a prostate cancer sample. FA and FA + DSG (FA+DSG) are projected in the same plot.
Figure 1.
Figure 1.. Experimental design.
Overview of experimental design for cell lines (A) and human tumor tissue (B).
Figure 2.
Figure 2.. DSG increases TF ChIP-seq quality in cell line models.
(A) Left: Genome browser snapshots of AR, FOXA1, H3K4me3, and H3K27ac binding in LNCAP cells (left) with and without DSG treatment (FA: blue. FA+DSG: red). Right: Genome browser snapshots of ERα, FOXA1, H3K4me3, and H3K27ac in MCF7 cells (right) with and without DSG (FA: blue. FA+DSG: red). Tag count and gene IDs are indicated. (B) Venn diagram showing the overlap of binding sites using FA (blue) and FA along with DSG (red) in LNCAP (top) and MCF7 (bottom) cells for AR, ERα, FOXA1, H3K4me3, and H3K27ac. (C) Intensity plots showing the read densities over the peaks (±5 kb) in profiles generated using FA (−) and FA along with DSG (+). The fraction of reads in peaks (FRiP score) is placed above each intensity plot. (D) Genomic distribution for sites shared or unique to FA with or without DSG, using LNCAP and MCF7 cells. (E) Comparison of percentage of binding sites with AR and FOXA1 motifs in LNCAP cells as well as for ERα and FOXA1 motifs in MCF7 cells for sites using FA with or without DSG.
Figure S2.
Figure S2.. ChIP-QPCR validation experiments in cell lines.
For LNCaP (A) and MCF-7 (B), ChIP-QPCR was performed, using the primers indicated. IgG-negative control is indicated. See Table S2 for primer sequences. Data are normalized over negative control region and input. Error bars indicate SD from three replicates.
Figure S3.
Figure S3.. Increased signal intensity and significant enrichment of transcription factor motifs is observed with DSG in cell line models.
(A) Distribution of AR motifs around AR binding sites and FOXA1 motif around FOXA1 binding sites in LNCAP cells (top segment). Distribution of ER motifs around ER binding sites and FOXA1 motif around FOXA1 binding sites in MCF7 cells (bottom segment). (B) Scatterplot depicts the correlation of reads between the binding sites identified using FA and FA along with DSG (FA+DSG) for AR, FOXA1, H3K4me3, and H3K27ac in LNCAP cells and ER, FOXA1, H3K4me3, and H3K27ac in MCF7 cells.
Figure S4.
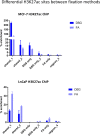
Figure S4.. H3K27ac ChIP-QPCR analyses for differential sites identified between the two fixation methods.
MCF-7 (top) and LNCaP (bottom) cells were used. Primers were designed for sites, selectively enriched between FA only or FA+DSG (see Table S2 for primer sequences). Data are normalized over negative control and input. Error bars indicate SD from three replicates.
Figure 3.
Figure 3.. ChIP-seq analyses in primary in prostate tissue.
(A) Genome browser snapshot of AR, FOXA1, and H3K27ac binding profiles in primary prostate specimens, with and without DSG treatment (FA: blue. FA+DSG: red). Tag count and gene IDs are indicated. (B) Venn diagram showing the overlap of binding sites between the ChIP-seq profiles generated using FA (blue) and FA along with DSG (red) for AR, FOXA1, and H3K27ac. (C) Intensity plots showing the read densities over the peaks (±5 kb) in profiles generated using FA (−) and FA along with DSG (+). The FRiP score is placed above each intensity plot. (D) Genomic distribution of sites identified in prostate specimens fixed with FA and DSG (FA+DSG). (E) Percentage of sites containing AR and FOXA1 motifs, under FA+DSG conditions. (F) Venn diagram depicting union of all AR binding sites previously reported in primary prostate cancer versus the sites identified from samples fixed with FA and DSG. The intensity plot shows the read density of the previously published AR binding sites (±5 kb).
Figure 4.
Figure 4.. ChIP-seq analyses in primary breast tissue.
(A) ChIP-seq overview of ERα, FOXA1, and H3K27ac binding profiles with and without DSG treatment (FA: blue. FA+DSG: red). Tag counts and gene IDs are indicated. (B) Venn diagram showing the overlap of binding sites between the ChIP-seq profiles generated using conventional cross-linker FA (blue) and FA along with DSG (red) for ERα, FOXA1, and H3K27ac. (C) Intensity plots showing the read densities over the peaks (±5 kb) in profiles generated using FA (−) and FA along with DSG (+). The FRiP score is placed above each intensity plot. (D) Genomic distribution of ERα and FOXA1 sites in samples processed with FA and DSG (FA+DSG). (E) Percentage of ERα and FOXA1 sites in FA/DSG fixed samples positive for ESR1 and FOXA1 motifs. (F) Venn diagram of union of ERα binding sites from published datasets and ERα sites identified in FA/DSG-treated sample. The intensity plot shows the read density of the previously published ERα binding sites (±5 kb).
Figure 5.
Figure 5.. ChIP-seq analyses in primary endometrial tissue.
(A) Genome browser snapshots of ERα and H3K27ac sites in endometrial tumors, in FA-fixed samples with and without DSG treatment (FA: blue. FA+DSG: red). (B) Venn diagram showing the overlap of sites for ERα and H3K27ac using FA (blue) and FA along with DSG (red). (C) Intensity plots showing the read densities over the peaks (±5 kb) in profiles generated using FA (−) and FA along with DSG (+). The fraction of reads in peaks (FRiP score) is placed above each intensity plot. (D) Genomic distribution of sites for ERα and H3K27ac in FA/DSG fixed samples (FA+DSG). (E) Percentage sites of ERα sites in FA/DSG fixed samples positive for ESR1 motifs. (F) Venn diagram of union of all ERα sites previously reported in endometrial tumors and sites identified in FA/DSG-fixed samples. The intensity plot shows the read density of the previously published ERα binding sites (±5 kb).
Figure S5.
Figure S5.. ChIP-QPCR validation analyses in prostate cancer samples.
ChIP for AR, FOXA1, H3K27ac, H3K4me3, or IgG control was performed, and QPCR was performed using the primers indicated (see Table S2 for primer sequences). Data are normalized over negative control region and input. Error bars indicate SD values of three replicates.
Figure S6.
Figure S6.. ChIP-QPCR validation analyses in breast cancer samples.
ChIP for ERα, FOXA1, H3K27ac, H3K4me3, or IgG control was performed, and QPCR was performed using the primers indicated (see Table S2 for primer sequences). Data are normalized over negative control region and input. Error bars indicate SD values of three replicates.
Figure S7.
Figure S7.. ChIP-QPCR validation analyses in endometrial cancer samples.
ChIP for ERα, H3K27ac, H3K4me3, or IgG control was performed, and QPCR was performed using the primers indicated (see Table S2 for primer sequences). Data are normalized over negative control region and input. Error bars indicate SD values of three replicates.
Figure S8.
Figure S8.. Increased signal intensity and significant enrichment of transcription factor motifs is observed with DSG in primary prostate tissue.
(A) Distribution of AR motifs around AR binding sites (left) and FOXA1 motif around FOXA1 binding sites (right) in prostate tissue (n = 4). (B) Scatterplot depicts the correlation of reads between the binding sites identified using FA and FA along with DSG (FA+DSG) for AR, FOXA1, and H3K27ac in prostate tissue (n = 4).
Figure S9.
Figure S9.. Increased signal intensity and significant enrichment of transcription factor motifs is observed with DSG in breast tissue.
(A) Venn diagram showing the overlap of binding sites between the ChIP-seq profiles generated using conventional cross linker FA (blue) and FA along with DSG (red) for H3K4me3. (B) Intensity plots showing the read densities over the peaks (±5 kb) in profiles generated using FA (−) and FA along with DSG (+). The fraction of reads in peaks (FRiP score) is placed above each intensity plot. (C) Genomic distribution of H3K4me3 enriched sites that are exclusive for FA- and DSG-treated sample (FA+DSG). (D) Distribution of ER motifs around ER binding sites and FOXA1 motif around FOXA1 binding sites in prostate tissue (n = 4). (E) Scatterplot depicts the correlation of reads between the binding sites identified using FA and FA along with DSG (FA+DSG) for ER, FOXA1, and H3K27ac in breast tissue (n = 4).
Figure S10.
Figure S10.. Increased signal intensity and significant enrichment of transcription factor motifs is observed with DSG in endometrial tissue.
(A) Distribution of ER motifs around ER binding sites in endometrium tissue (n = 3). (B) Scatterplot depicts the correlation of reads between the binding sites identified using FA and FA along with DSG (FA+DSG) for ER and H3K27ac in endometrium tissue (n = 3).
Figure S11.
Figure S11.. Coverage plots of H3K27ac ChIP-seq data in prostate cancer specimens.
For the different subgroups of peaks (shared, FA unique, FA+DSG unique, Venn diagram Fig 3B), raw read counts were visualized. To illustrate the conservation of signal between tumors, signal for all four tumors analyses was depicted, separately analyzing the genomic regions as identified in tumors 1, 2, 3, or 4.
Figure S12.
Figure S12.. Coverage plots of H3K27ac ChIP-seq data in breast cancer specimens.
For the different subgroups of peaks (shared, FA unique, FA+DSG unique, Venn diagram Fig 4B), raw read counts were visualized. To illustrate the conservation of signal between tumors, signal for all four tumors analyses was depicted, separately analyzing the genomic regions as identified in tumors 1, 2, 3, or 4.
Figure S13.
Figure S13.. Coverage plots of H3K27ac ChIP-seq data in endometrial cancer specimens.
For the different subgroups of peaks (shared, FA unique, FA+DSG unique, Venn diagram Fig 5B), raw read counts were visualized. To illustrate the conservation of signal between tumors, signal for all four tumors analyses was depicted, separately analyzing the genomic regions as identified in tumors 1, 2, or 3.
Figure S14.
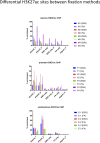
Figure S14.. ChIP-QPCR validation for H3K27ac, analyzing regions shared between both fixation methods, or those selectively identified for FA or FA+DSG.
Breast (top), prostate (middle), and endometrial (bottom) data are depicted separately. Data are normalized over negative control and input. Error bars indicate SD of triplicate measurements.
Figure S15.
Figure S15.. Breast H3K27ac ChIP-seq validation series. For H3K27ac ChIP-seq, peak subsets identified for each tumor sample were analysed separately.
Read counts at these genomic regions were determined, using publicly available H3K27ac ChIP-seq data from primary breast cancers (Patten et al, 2018).
Figure S16.
Figure S16.. Prostate H3K27ac ChIP-seq validation series. For H3K27ac ChIP-seq, peak subsets identified for each tumor sample were analysed separately.
Read counts at these genomic regions were determined, using publicly available H3K27ac ChIP-seq data from primary prostate cancers (Kron et al, 2017).
Figure S17.
Figure S17.. Endometrium H3K27ac ChIP-seq validation series.
For H3K27ac ChIP-seq, peak subsets identified for each tumor sample were analysed separately. Read counts at these genomic regions were determined, using publicly available H3K27ac ChIP-seq data from primary prostate cancers (Droog et al, 2017).
Figure 6.
Figure 6.. Generating ChIP-seq profiles from 18G core needle biopsies from radical prostatectomy samples.
(A) Genome browser snapshots for AR, FOXA1, and H3K27ac ChIP-seq with and without DSG treatment (FA: blue. FA+DSG: red). Tag count and gene IDs are indicated. (B) Number of binding sites for AR, FOXA1, and H3K27ac. (C) Intensity plots showing the read densities over the peaks (±5 kb) in samples fixed with FA (−) or FA along with DSG (+). The FRiP score is placed above each intensity plot. (D) Genomic distribution of AR, FOXA1, and H3K27ac binding sites. (E) Percentage of AR and FOXA1 binding sites that are positive of motifs for AR and FOXA1. (F) Venn diagram of AR (FA+DSG) binding sites and union of all AR sites previously reported in primary prostate cancers. The intensity plot shows the read density for the previously published AR binding sites (±5 kb).
Figure S18.
Figure S18.. Distribution of AR motifs around AR binding sites (left) and FOXA1 motif around FOXA1 binding sites (right) in prostate tissue.

References

    1. Aoki T, Wolle D, Preger-Ben Noon E, Dai Q, Lai EC, Schedl P (2014) Bi-functional cross-linking reagents efficiently capture protein-DNA complexes in Drosophila embryos. Fly (Austin) 8: 43–51. 10.4161/fly.26805 - DOI - PMC - PubMed
    1. Brinkmann AO, Blok LJ, de Ruiter PE, Doesburg P, Steketee K, Berrevoets CA, Trapman J (1999) Mechanisms of androgen receptor activation and function. J Steroid Biochem Mol Biol 69: 307–313. 10.1016/s0960-0760(99)00049-7 - DOI - PubMed
    1. D'Santos C, Taylor C, Carroll JS, Mohammed H (2015) RIME proteomics of estrogen and progesterone receptors in breast cancer. Data Brief 5: 276–280. 10.1016/j.dib.2015.08.019 - DOI - PMC - PubMed
    1. Droog M, Nevedomskaya E, Dackus GM, Fles R, Kim Y, Hollema H, Mourits MJ, Nederlof PM, van Boven HH, Linn SC, et al. (2017) Estrogen receptor alpha wields treatment-specific enhancers between morphologically similar endometrial tumors. Proc Natl Acad Sci U S A 114: E1316–E1325. 10.1073/pnas.1615233114 - DOI - PMC - PubMed
    1. Engelen E, Brandsma JH, Moen MJ, Signorile L, Dekkers DH, Demmers J, Kockx CE, Ozgur Z, van IWF, van den Berg DL, et al. (2015) Proteins that bind regulatory regions identified by histone modification chromatin immunoprecipitations and mass spectrometry. Nat Commun 6: 7155 10.1038/ncomms8155 - DOI - PMC - PubMed

Publication types

MeSH terms