. 2019 Jan 8:8:e41815.
doi: 10.7554/eLife.41815.

Immune genes are hotspots of shared positive selection across birds and mammals

Affiliations

Immune genes are hotspots of shared positive selection across birds and mammals

Allison J Shultz et al. Elife. .

Abstract

Consistent patterns of positive selection in functionally similar genes can suggest a common selective pressure across a group of species. We use alignments of orthologous protein-coding genes from 39 species of birds to estimate parameters related to positive selection for 11,000 genes conserved across birds. We show that functional pathways related to the immune system, recombination, lipid metabolism, and phototransduction are enriched for positively selected genes. By comparing our results with mammalian data, we find a significant enrichment for positively selected genes shared between taxa, and that these shared selected genes are enriched for viral immune pathways. Using pathogen-challenge transcriptome data, we show that genes up-regulated in response to pathogens are also enriched for positively selected genes. Together, our results suggest that pathogens, particularly viruses, consistently target the same genes across divergent clades, and that these genes are hotspots of host-pathogen conflict over deep evolutionary time.

Keywords: birds; chicken; comparative genomics; comparative transcriptomics; evolutionary biology; genetics; genomics; host-pathogen co-evolution; mammals; viruses.


Conflict of interest statement

AS, TS No competing interests declared

Figures
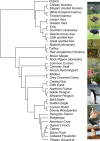
Figure 1.
Figure 1.. Species tree of 39 species used in study.
Photo credit from Wikimedia Commons (top to bottom): Elegant Crested Tinamou: DickDaniels, Greater Rhea: Quartl, Southern Cassowary: Summerdrought, Mallard: Dcoetzee, Red Junglefowl: Francesco Veronesi, Common Cuckoo: Mike McKenzie, Anna’s Hummingbird: Becky Matsubara, Little Egret: GDW.45, Adelie Penguin: Stan Shebs, Downy Woodpecker: Wolfgang Wander, American Crow: DickDaniels, Zebra Finch: Jim Bendon.
Figure 2.
Figure 2.. Distributions of gene-wide statistics using gene trees or species trees as the input phylogeny.
(A) Comparison of M0 model ω values between genes under selection for all site tests, and those not under selection, for both gene trees and species trees. The mean ω values were significantly higher for genes under selection for both gene trees and species trees (Mann-Whitney U-test: gene trees: W = 1201387, p < 0.0001; species trees: W = 938934, p < 0.0001). (B) Violin plot of ω values from the PAML M0 model using either gene trees or species trees as the input phylogeny. (C) Violin plot of alignment lengths for genes significant in all tests of selection, or not significant in all tests of selection using either gene trees or species trees as input phylogenies. (D) Distribution of the proportion of significant lineages for HOGs identified as not significant (FDR-corrected p-value ≥ 0.05), or significant (FDR-corrected p-values < 0.05) with BUSTED. The means of the two distributions are significantly different (Mann-Whitney U-test: W= 6205530, p<10-16).
Figure 3.
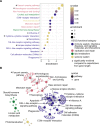
Figure 3.. Pathway enrichment results to determine whether positively selected genes are functionally similar with chicken as the reference organism.
(A) The 18 pathways significant at q-value < 0.1 ordered by enrichment values, calculated as the proportion of genes under selection in the pathway over the proportion of genes significant in all KEGG pathways. Points are filled by q-value, and each pathway is colored by the broader KEGG functional category. Edge lengths do not contain meaningful values, but are chosen to maximize viewability. Pathways with more genes under selection than expected based on median gene length are highlighted with an asterisk. (B) Map depicting the relationships of all significant genes among pathways. Each gene (small, light circle) is connected by a line to each pathway it belongs to (large, dark circle). Each point is shaded according to the broader KEGG functional category. See Figure 3—figure supplement 1 for pathways identified using species trees.
Figure 3—figure supplement 1.
Figure 3—figure supplement 1.. Pathways enriched using results from species trees as the input phylogeny.
Figure 4.
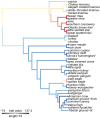
Figure 4.. A visualization of PC1 scores estimated by the proportion of sites under selection using gene trees on the phylogeny and the maximum likelihood reconstruction of the PC1 values for internal branches.
The PC1 scores indicate species in different clades that have similar parameter estimates from aBS-REL tests for positive selection and explain 7.2% of the variance across all genes tested. See Figure 4 supplement 1 for a visualization of PC1 estimated using ω values and gene trees, Figure 4 supplement 2 for a visualization of PC1 estimated using the proportion of sites under selection using species trees, Figure 4 supplement 3 for a visualization of PC1 estimated using ω using species trees, and Figure 4 supplement 4 for a visualization of eigenvalues for all PCAs.
Figure 4—figure supplement 1.
Figure 4—figure supplement 1.. (A) visualization of PC1 scores estimated by the ω estimates using gene trees on the phylogeny and the maximum likelihood reconstruction of the PC1 values for internal branches.
The PC1 scores explain 7.6% of the variance across all genes tested.
Figure 4—figure supplement 2.
Figure 4—figure supplement 2.. (A) visualization of PC1 scores estimated by the proportion of sites under selection using species trees on the phylogeny and the maximum likelihood reconstruction of the PC1 values for internal branches.
The PC1 scores explain 7.6% of the variance across all genes tested.
Figure 4—figure supplement 3.
Figure 4—figure supplement 3.. (A) visualization of PC1 scores estimated by the ω estimates using species trees on the phylogeny and the maximum likelihood reconstruction of the PC1 values for internal branches.
The PC1 scores explain 7.6% of the variance across all genes tested.
Figure 4—figure supplement 4.
Figure 4—figure supplement 4.. Visualization of the variance explained by the first 10 PC axes (scree plot).
PCA of the (A) proportion of sites under selection using gene trees, (B) log-transformed ω values using gene trees, (C) proportion of sites under selection using species trees, and D) ω values using species trees across genes for each species.
Figure 5.
Figure 5.. A phylomorphospace plot showing the association between log-transformed body mass on the x-axis and PC1 estimated from the proportion of sites under selection on the y-axis.
Species values and reconstructed node values are connected by phylogeny. A PGLS analysis of these two traits showed a significant correlation (p=0.0001). See Figure 5—figure supplement 1 for a phylomorphospace plot depicting PC1 estimated using ω estimates.
Figure 5—figure supplement 1.
Figure 5—figure supplement 1.. A phylomorphospace plot showing the association between log-transformed body mass on the x-axis and PC1 estimated from the ω estimates on the y-axis.
Species values and reconstructed node values are connected by phylogeny. A PGLS analysis of these two traits showed a significant correlation (p=0.0016).
Figure 6.
Figure 6.. Signatures of shared positive selection in birds and mammals.
For all analyses, we considered four different FDR-corrected p-value cutoffs for significance (to identify genes under positive selection) A. Odds ratio of overlap in genes under selection in both bird and mammal datasets. We indicate the number of observed genes under selection in both clades (n obs) and the number of expected genes under selection in both clades (n exp). B. Pathway enrichment scores from KEGG pathway enrichment tests with genes under selection in both birds and mammals as the test set, and genes under selection in birds as the background set. Ten pathways significantly enriched in birds with at least one gene under selection in both birds and mammals are color-coded. All other pathways are shown in grey. Significant enrichment values are outlined in black (q-value < 0.1) or grey (q-value < 0.2). C. Null distribution of enrichment scores generated from 1,000 randomization tests compared to empirical enrichment scores (vertical bars). Null distributions were generated by randomly selecting gene sets from the background set of genes (bird significant genes) for use as the test set. The randomized test set contained the same number of genes as empirical test set for each FDR-corrected p-value cutoff for significance. Empirical enrichment scores are depicted by a vertical bar, and with significant q-value scores outlined in black (q-value < 0.1) or grey (q-value < 0.2). See Figure 6 Supplement 1 for the odds ratio overlap in genes under selection in both bird and mammal datasets with the 20% most constrained genes removed.
Figure 6—figure supplement 1.
Figure 6—figure supplement 1.. Odds ratio overlap of bird and mammal genes under selection with 20% most constrained genes (as estimated by the m0 model) removed.
Figure 7.
Figure 7.. A comparison of genes under positive selection in birds and genes differentially expressed following pathogen challenge to test for patterns of pathogen-mediate selection.
For different pathogens, we show the proportion of genes under positive selection in birds (defined as significant with FDR corrected p-value < 0.05 for all PAML and BUSTED model comparisons) for genes down significantly down regulated, significantly up regulated, or not significantly differentially regulated. The number above each bar indicates the number of genes in a given transcriptional response class. The significance of enrichment for positively-selected genes in up- or down-regulated expression classes, as calculated by logistic regression, is indicated by asterisks above the “down” and “up” bars.
Figure 8.
Figure 8.. Comparison of differential expression effect values for groups of genes, across pathogens with transcriptome data available for both birds and mammals.
Groups of genes are defined as being under positive selection in both birds and mammals, in birds only, or neither birds nor mammals (not significant). Differential expression effect values for each gene are calculated as the harmonic mean of the absolute β values of birds and mammals. We compared the mean of each category to that of the other two categories within each pathogen with Mann-Whitney U-tests, and the significance-level for each test is indicated by asterisks. Comparisons with p>0.10 are left blank. Note that boxplot outliers are not depicted.

References

    1. Alcaide M, Edwards SV. Molecular evolution of the toll-like receptor multigene family in birds. Molecular Biology and Evolution. 2011;28:1703–1715. doi: 10.1093/molbev/msq351. - DOI - PubMed
    1. Alcaide M, Liu M, Edwards SV. Major histocompatibility complex class I evolution in songbirds: universal primers, rapid evolution and base compositional shifts in exon 3. PeerJ. 2013;1:e86. doi: 10.7717/peerj.86. - DOI - PMC - PubMed
    1. Altenhoff AM, Gil M, Gonnet GH, Dessimoz C. Inferring hierarchical orthologous groups from orthologous gene pairs. PLoS ONE. 2013;8:e53786. doi: 10.1371/journal.pone.0053786. - DOI - PMC - PubMed
    1. An L, Wang Y, Liu Y, Yang X, Liu C, Hu Z, He W, Song W, Hang H. Rad9 is required for B cell proliferation and immunoglobulin class switch recombination. Journal of Biological Chemistry. 2010;285:35267–35273. doi: 10.1074/jbc.M110.161208. - DOI - PMC - PubMed
    1. Andersson MN, Wang H-L, Nord A, Salmón P, Isaksson C. Composition of physiologically important fatty acids in great tits differs between urban and rural populations on a seasonal basis. Frontiers in Ecology and Evolution. 2015;3:522. doi: 10.3389/fevo.2015.00093. - DOI