. 2019 Mar 1;129(3):1240-1256.
doi: 10.1172/JCI123959. Epub 2019 Feb 11.

Loss of the sphingolipid desaturase DEGS1 causes hypomyelinating leukodystrophy

Affiliations

Loss of the sphingolipid desaturase DEGS1 causes hypomyelinating leukodystrophy

Devesh C Pant et al. J Clin Invest. .

Abstract

Sphingolipid imbalance is the culprit in a variety of neurological diseases, some affecting the myelin sheath. We have used whole-exome sequencing in patients with undetermined leukoencephalopathies to uncover the endoplasmic reticulum lipid desaturase DEGS1 as the causative gene in 19 patients from 13 unrelated families. Shared features among the cases include severe motor arrest, early nystagmus, dystonia, spasticity, and profound failure to thrive. MRI showed hypomyelination, thinning of the corpus callosum, and progressive thalamic and cerebellar atrophy, suggesting a critical role of DEGS1 in myelin development and maintenance. This enzyme converts dihydroceramide (DhCer) into ceramide (Cer) in the final step of the de novo biosynthesis pathway. We detected a marked increase of the substrate DhCer and DhCer/Cer ratios in patients' fibroblasts and muscle. Further, we used a knockdown approach for disease modeling in Danio rerio, followed by a preclinical test with the first-line treatment for multiple sclerosis, fingolimod (FTY720, Gilenya). The enzymatic inhibition of Cer synthase by fingolimod, 1 step prior to DEGS1 in the pathway, reduced the critical DhCer/Cer imbalance and the severe locomotor disability, increasing the number of myelinating oligodendrocytes in a zebrafish model. These proof-of-concept results pave the way to clinical translation.

Keywords: Neurodegeneration; Neuroscience.


Conflict of interest statement

Conflict of interest: The authors have declared that no conflict of interest exists.

Figures

Figure 1
Figure 1. Scheme depicting enzyme defects associated with neurological disorders in the sphingolipid metabolism pathway, and fingolimod (FTY720) action.
Serine palmitoyltransferase (SPT) catalyzes the initial reaction of the de novo sphingolipid pathway. Dihydrosphingosine is produced after an intermediate step regulated by 3-keto-dihydrosphingosine reductase (KDS), which is then followed by acylation by ceramide synthase (CerS) to produce dihydroceramide. The final reaction is the addition of a double bond by dihydroceramide desaturase (DEGS1) to form ceramide. Ceramide is metabolized by ceramidase (CDse) to generate sphingosine, which in turn produces sphingosine 1-phosphate through phosphorylation by sphingosine kinase-1 and sphingosine kinase-2 (SphK1/2). Sphingosine 1-phosphate can be catabolized into hexadecenal and ethanolamine phosphate by sphingosine 1-phosphate lyase (S1PL). Ceramide can be generated by the breakdown of sphingomyelin (SM) by acid (ASM) or neutral sphingomyelinase (NSM). FTY720 has inhibitory effects on CerS. Enzyme (in bold) defects are indicated by solid bars across the blue arrows. The names of diseases are shown in red text. ACER3, alkaline ceramidase 3; GalCer, galactosylceramide; HSN1, hereditary sensory neuropathy type I; MLD, metachromatic leukodystrophy; PD, Parkinson disease; Sap, saposin.
Figure 2
Figure 2. Schematic representation of human DEGS1 (NP_003667.1) and its functional domains with variants identified in patients.
(A) DEGS1 has 323 amino acids. Numbers on the scheme of the protein line indicate the boundaries of each transmembrane domain. The lipid DES domain (red) of DEGS1 comprises amino acids 6–42. The histidine domains (orange) of DEGS1 comprise amino acids 89–93, 128–132, and 259–263. The transmembrane domains (green) of DEGS1 comprise amino acids 43–62, 68–92, 104–122, 150–172, 184–202, and 210–231. The fatty acid desaturase (FAD) domain covers amino acids 64–293. (B) Schematic of the human DEGS1 locus, which consists of 3 exons. Patient (P) numbers are indicated above the mutations. Multiple protein sequence alignment of DEGS1 orthologs show conservation of missense mutations detected in cases (bottom). The lipid DES, transmembrane, and histidine domains are indicated by red, green, and orange shading, respectively. The alignment was performed with ClustalW (http://www.clustal.org/) using the following RefSeq numbers: NP_003667.1, Homo sapiens; NP_031879.1, Mus musculus; NP_445775.2, Rattus norvegicus; NP_001007485.1, Xenopus tropicalis; NP_997865.1, Danio rerio; NP_476594.1, Drosophila melanogaster; NP_493549.1, Caenorhabditis elegans.
Figure 3
Figure 3. Brain MRIs according to clinical severity and followup.
(A) MRIs of patients with distinct clinical severity at the age of 6 years. Patient 7 (top row) shows the mildest presentation, with walking acquisition and spastic paraplegia. In FLAIR sequences, mild hyperintensities of the periventricular white matter (WM), with normal CC and internal capsule were observed. In T1 sagittal sequences, normal cerebellum and CC were observed. Patient 9 (bottom row) was able to hold the head but developed dystonia and spasticity with failure to thrive (–4 SD). Despite this severe clinical presentation, the FLAIR sequences show an abnormal hypersignal of the WM only in the periventricular and deep regions that are atrophic. The CC and the cerebellar vermis are atrophic. (B) Sequential MRIs of patient 16. At 6 months, all the WM structures including the cerebellum, the brainstem, and the CC appear unmyelinated. The CC is thin on the T1 sagittal section. A progression in the myelination has occurred at 2.5 years of age but the posterior part of the internal capsules is not myelinated, with periventricular hypersignals and an isosignal of the deep and subcortical WM and atrophic thalami. At 4 years of age the internal capsules and the deep and subcortical WM show normal myelinated signal, whereas the thalami and cerebellar vermis appeared as hypersignals and atrophic.
Figure 4
Figure 4. Dihydroceramide and ceramide imbalance in human patient fibroblasts and muscle.
(A) Ceramides (Cer), dihydroceramides (DhCer), and the DhCer/Cer ratios in human controls (n = 9) and patient fibroblasts (P4, P7, and P9) (n = 3) and (B) in human controls (n = 5) and patient muscle (P3) (n = 1). Data are represented as percentage of total Cer and DhCer. (C) Intracellular ROS was quantified using the probe H2DCFDA in patient fibroblasts (patients 4, 7, and 9) and controls (n = 5) at a basal level. (D) Exogenous DhCer (C18:0) treatment (20 μM, 6 hours) was applied to control and patient fibroblasts. Antimycin was used as positive control for ROS generation. The fibroblast results are from 3 independent experiments performed in triplicate. Data are shown as the mean ± SD. *P < 0.05; **P < 0.01; ***P < 0.001 by 1-way ANOVA (A and C) or 2-way ANOVA followed by Tukey’s post hoc test (D).
Figure 5
Figure 5. Impact of degs1 knockdown in Danio rerio larvae.
(A) Ceramides (Cer), dihydroceramides (DhCer), and the DhCer/Cer ratios in MO-control and MO-DEGS1 zebrafish, n = 4/condition (5 larvae per tube/condition), at 5 dpf. Data are represented as percentage of total Cer and DhCer. (B) Representative images of the normal, mild, and severe phenotypes observed in the MO-control– and MO-DEGS1–injected groups. Scale bar: 100 μm. (C) Quantification at 5 dpf of the percentage of normal (blue), mild (purple), and severe (orange) phenotypes groups obtained. Values are the percentage ± SD of 3 independent experiments, with n = 50 animals per group per experiment. (D) Examples of digital tracks of 10 single larvae of each condition shown in red. (E) Scatter plot displaying the total movement distance by different larvae: uninjected larvae (n = 20), 1,564.4 ± 321.6 mm; MO-control (n = 30), 1,146.6 ± 255.2 mm; and MO-DEGS1 (n = 33), 28.3 ± 24.5 mm. (FH) Dorsal views of larvae injected with MO-control and MO-DEGS1, and (IK) inserts of boxed areas at 4.5 dpf. Scale bar: 100 μm. White arrows indicate MBP+ cells (myelinating oligodendrocytes). (L) Illustration of a tg(mbp:egfp) larva. (M) Scatter plot displaying the number of MBP+ cells in the dorsal spinal cord of 4.5-dpf larvae (MO-control, n = 30; MO-DEGS1, n = 28; MO-DEGS1 + 1 ng/μl FTY720, n = 19). Data are shown as the mean ± SD. *P < 0.05; **P < 0.01; ***P < 0.001 by 2-tailed unpaired Student’s t test (A) or 1-way ANOVA followed by Tukey’s post hoc test (E and M).
Figure 6
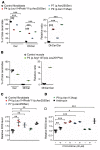
Figure 6. FTY720 ameliorates the locomotor, biochemical, and cellular phenotypes in MO-DEGS1 larvae and lowers ROS levels in patient fibroblasts.
(A) MO-DEGS1 larvae were treated for 120 hours with vehicle (Veh) or fingolimod (FTY720) at 0.3, 1.0, and 3.3 ng/μl. Digital tracks of larvae are shown in red. (B) Scatter plot (n = 20 per condition) showing total movement distance (mm) upon FTY720 treatment. Total movement distance (mm) traveled by MO-control larvae (vehicle, 1,268.2 ± 402.9 mm; FTY720, 1,230 ± 365.2 mm), compared with MO-DEGS1 (vehicle, 44.6 ± 39.2 mm) and the different treatment doses (3.3 ng/μl FTY720, 542.3 ± 238.8 mm; 1 ng/μl FTY720, 615.3 ± 330.8 mm; 0.3 ng/μl FTY720, 670.3 ± 476.6 mm). (C) Ceramides (Cer), dihydroceramides (DhCer), and the DhCer/Cer ratios in MO-control and MO-DEGS1 zebrafish treated with 1 ng/μl FTY720 (n = 4 [5 larvae per tube/condition] larvae/condition at 5 dpf). Data are represented as percentage of total Cer and DhCer. The results are from 3 independent experiments. (D) Intracellular ROS is partially normalized by FTY720 in patient fibroblasts (n = 3) compared with controls (n = 3). Data are shown as the mean ± SD. *P < 0.05; **P < 0.01; ***P < 0.001 by 2-way ANOVA followed by Tukey’s post hoc test.

References

    1. Köhler W, Curiel J, Vanderver A. Adulthood leukodystrophies. Nat Rev Neurol. 2018;14(2):94–105. - PMC - PubMed
    1. Parikh S, et al. A clinical approach to the diagnosis of patients with leukodystrophies and genetic leukoencephelopathies. Mol Genet Metab. 2015;114(4):501–515. doi: 10.1016/j.ymgme.2014.12.434. - DOI - PMC - PubMed
    1. van der Knaap MS, Bugiani M. Leukodystrophies: a proposed classification system based on pathological changes and pathogenetic mechanisms. Acta Neuropathol. 2017;134(3):351–382. doi: 10.1007/s00401-017-1739-1. - DOI - PMC - PubMed
    1. Dorboz I, et al. Biallelic mutations in the homeodomain of NKX6-2 underlie a severe hypomyelinating leukodystrophy. Brain. 2017;140(10):2550–2556. doi: 10.1093/brain/awx207. - DOI - PubMed
    1. Edvardson S, et al. Deficiency of the alkaline ceramidase ACER3 manifests in early childhood by progressive leukodystrophy. J Med Genet. 2016;53(6):389–396. doi: 10.1136/jmedgenet-2015-103457. - DOI - PMC - PubMed

Publication types

MeSH terms