. 2019 Mar 1;129(3):1229-1239.
doi: 10.1172/JCI124159. Epub 2019 Feb 11.

DEGS1-associated aberrant sphingolipid metabolism impairs nervous system function in humans

Affiliations

DEGS1-associated aberrant sphingolipid metabolism impairs nervous system function in humans

Gergely Karsai et al. J Clin Invest. .

Abstract

Background: Sphingolipids are important components of cellular membranes and functionally associated with fundamental processes such as cell differentiation, neuronal signaling, and myelin sheath formation. Defects in the synthesis or degradation of sphingolipids leads to various neurological pathologies; however, the entire spectrum of sphingolipid metabolism disorders remains elusive.

Methods: A combined approach of genomics and lipidomics was applied to identify and characterize a human sphingolipid metabolism disorder.

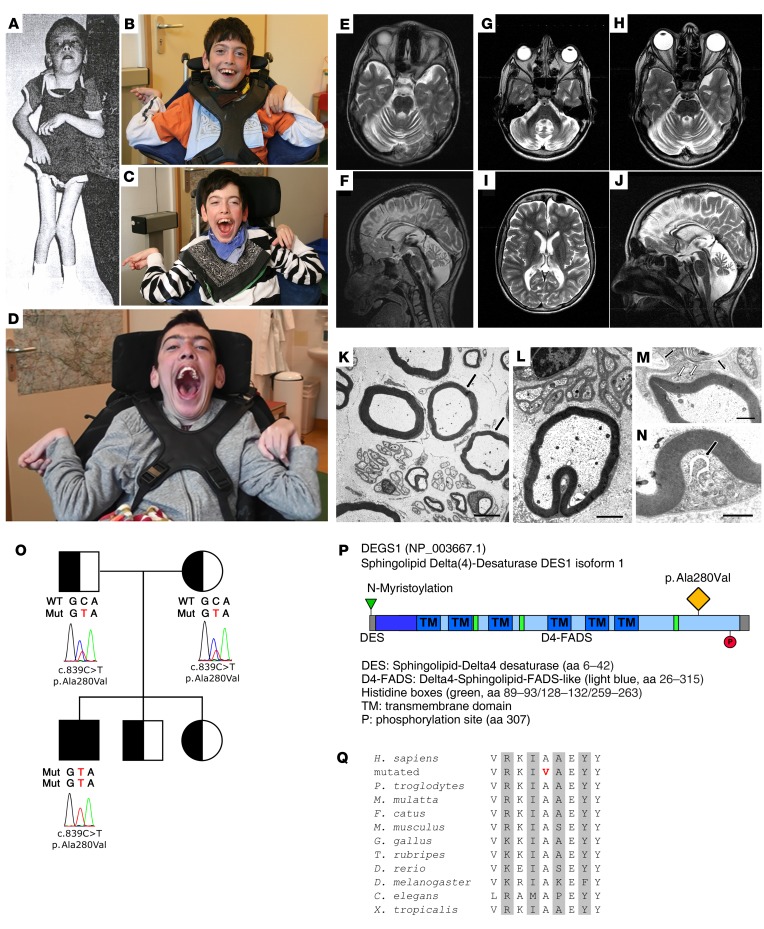
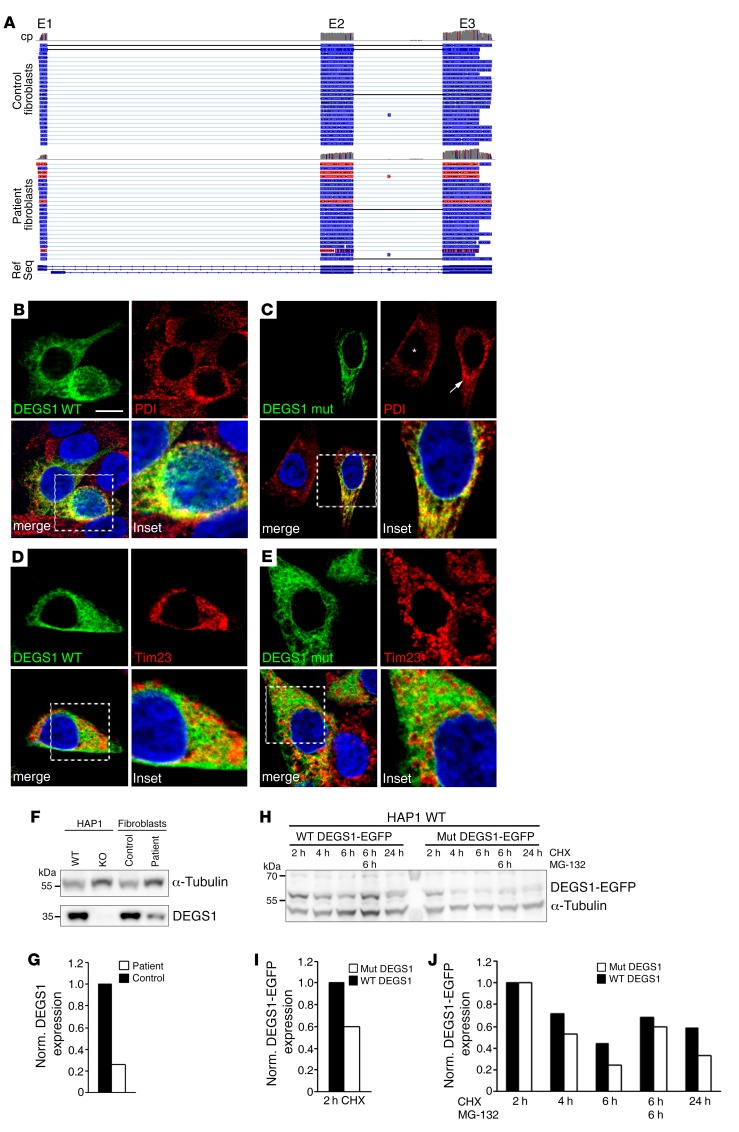
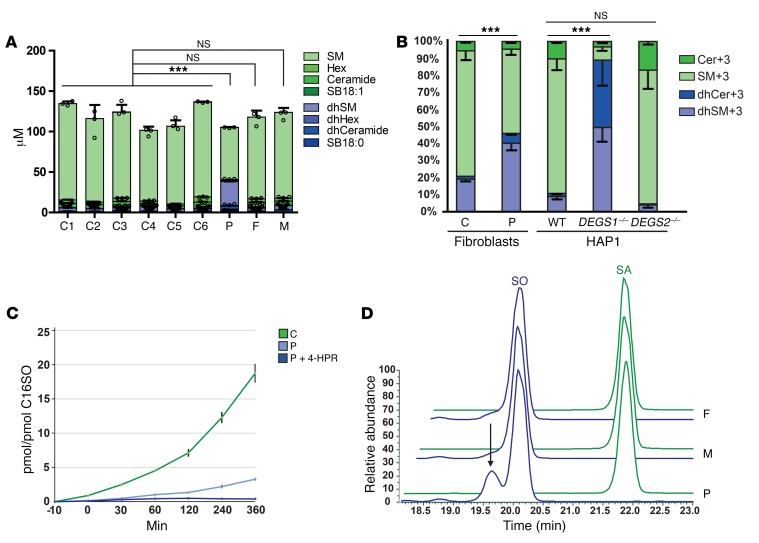
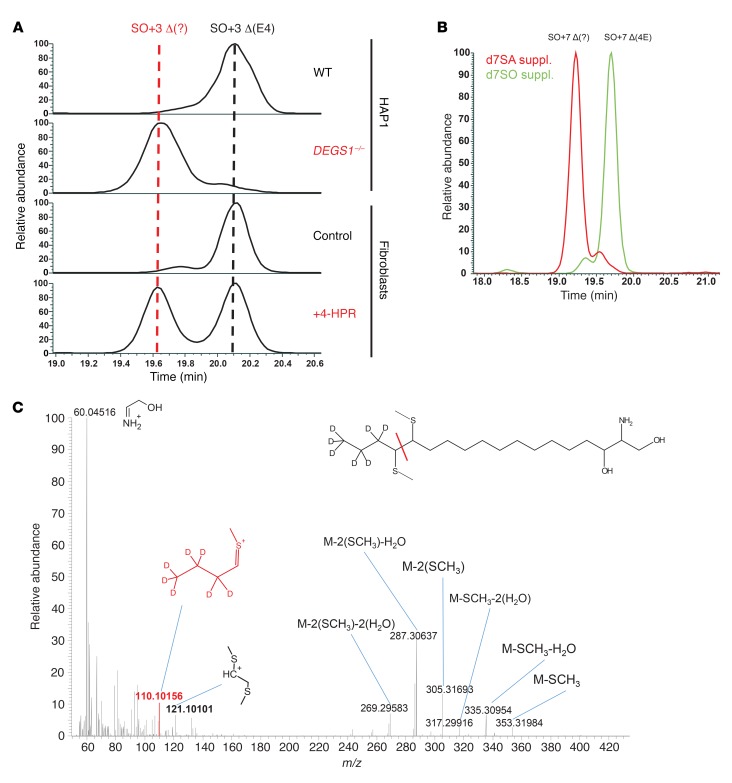
Results: By whole-exome sequencing in a patient with a multisystem neurological disorder of both the central and peripheral nervous systems, we identified a homozygous p.Ala280Val variant in DEGS1, which catalyzes the last step in the ceramide synthesis pathway. The blood sphingolipid profile in the patient showed a significant increase in dihydro sphingolipid species that was further recapitulated in patient-derived fibroblasts, in CRISPR/Cas9-derived DEGS1-knockout cells, and by pharmacological inhibition of DEGS1. The enzymatic activity in patient fibroblasts was reduced by 80% compared with wild-type cells, which was in line with a reduced expression of mutant DEGS1 protein. Moreover, an atypical and potentially neurotoxic sphingosine isomer was identified in patient plasma and in cells expressing mutant DEGS1.

Conclusion: We report DEGS1 dysfunction as the cause of a sphingolipid disorder with hypomyelination and degeneration of both the central and peripheral nervous systems.

Trial registration: Not applicable.

Funding: Seventh Framework Program of the European Commission, Swiss National Foundation, Rare Disease Initiative Zurich.

Keywords: Demyelinating disorders; Genetics; Metabolism; Monogenic diseases; Neurological disorders.


Conflict of interest statement

Conflict of interest: The authors have declared that no conflict of interest exists.

Figures

Figure 1
Figure 1. Clinical phenotype and genetics of the DEGS1 disorder.
Clinical phenotype with progression of spasticity, notably in the arms and hands. Patient at the age of 6 years (A), 13 years (B), 15 years (C), and at last followup at 22 years (D). T2-weighted MRI of the brain, axial (E, and GI) and sagittal (F and J), at 11 years of age (E and F) and 16 years (GJ). Severe and slowly progressive cerebellar atrophy with fiber degeneration of the middle cerebellar peduncles. The patient shows mild cortical atrophy and thin white matter, especially in the posterior brain regions. In summary, MRI findings are in line with a progressive global neurodegenerative process. (KN) Electron micrographs of the sural nerve biopsy performed at the age of 2 years reveals nerve fibers with disproportionately thin myelin sheaths (K, arrows). Scale bar: 3 μm. (L) Occasional, moderate myelin folding. Scale bar: 1.8 μm. (M) Small autophagic vacuoles in the cytoplasm of the Schwann cell of a myelinated nerve fiber (white arrows). Black arrows indicate large autophagic vacuoles containing membranous debris in an adjacent cell, which is covered by a basal lamina and may therefore be either a Schwann cell or a macrophage that has invaded a Schwann cell basal lamina sheath. Scale bar: 0.75 μm. (N) Widening of the endoplasmic reticulum (arrow) of a Schwann cell. Scale bar: 0.5 μm. (O) The pedigree of the family shows the segregation of the DEGS1 variant [NM_003676.3:c.839C>T, p.Ala280Val, Chr1(hg19):g.224380047C>T]. Sanger traces of the affected codon are shown in the index patient and his parents. (P) Domain architecture of the human DEGS1 protein. Position of the mutation is indicated in orange. (Q) Species alignment of the amino acid residues in proximity of the DEGS1 mutation. Mutation highlighted in red. FADS, fatty acid desaturase domain.
Figure 2
Figure 2. Characterization of mutant DEGS1 protein.
The DEGS1 p.Ala280Val mutation decreases protein stability. (A) IGV plots of direct cDNA nanopore sequencing results. The upper part of each plot shows the coverage plot (cp, gray) and the lower part the single reads. (BE) Cellular distribution of DEGS1 WT and the DEGS1 mutant (p.Ala280Val). EGFP-tagged (B) WT and (C) mutant DEGS1 colocalize with the endoplasmic reticulum marker protein disulfide isomerase (PDI). The reticular staining pattern of PDI in untransfected cells (asterisk in C) seems undisturbed in mut DEGS1–overexpressing cells (arrow in C). (D and E) Only minor overlap of immunofluorescence signals is observed for EGFP-tagged WT– and mut DEGS1–overexpressing cells with the mitochondrion inner membrane marker Tim23. Scale bar: 10 μm; insets show 2-fold magnification. (F and G) DEGS1 expression was analyzed by Western blot in HAP1 WT and HAP1 DEGS1–/– cells or fibroblasts from a healthy control and the index patient. (G) Reduced DEGS1 protein levels in patient fibroblasts, quantified from the blot in F (normalized to α-tubulin and the control sample). (H) DEGS1-EGFP expression in HAP1 WT cells transfected with pEF1α-WT DEGS1-EGFP or mut DEGS1-EGFP after treatment with cycloheximide (CHX) and MG-132 for the indicated times. (I and J) Quantification of WT and mut DEGS1-EGFP protein amounts from H normalized to α-tubulin and DEGS1-EGFP (I) or WT DEGS1-EGFP and mut DEGS1-EGFP (J).
Figure 3
Figure 3. Lipidomics analysis of mutant DEGS1.
(A) Lipidomics analysis showed a significant elevation of dhSL species (dhCer, dhSM, and dhHexCer) in patient plasma (P) compared with parents (F, M) or unrelated controls (C1–6). (B) Cultured patient-derived fibroblasts showed an increase in de novo–synthesized dhSL (dhCer+3 and dhSM+3) compared with cells from unrelated controls. Increased dhSL levels were also seen in DEGS1–/– HAP1 cells where the dhSL species reached up to 90% of the total SLs. In contrast, WT cells had less than 15% dhSL species. Slightly decreased dhSL levels were observed in DEGS2–/– cells. (C) Kinetics of the DEGS1 reaction in control and patient fibroblasts. Cells were supplemented with 2 μM d7SA (arrow) and the increase in total SO+7 was followed over time. Values were normalized to internal C16SO levels (ISTD). In patient-derived fibroblasts, DEGS1 activity was 5-fold lower compared with controls. This residual activity was fully inhibited in the presence of the DEGS1 inhibitor 4-HPR (2 μM). (D) The sphingoid-base profile after hydrolysis revealed an isomeric SO metabolite (arrow) with an approximately 30-second-shorter retention time. The metabolite could be detected in the patient plasma but not in plasma of the parents or unrelated controls. No isomeric peak was seen for SA (green). n = 3; data presented as the mean ±SD or –SD. ***P < 0.001 by 1-way ANOVA with Tukey’s correction for multiple testing.
Figure 4
Figure 4. Characterization of a previously unidentified sphingoid base in the DEGS1 disorder.
(A) HAP1 WT or DEGS1–/– cells were cultured in the presence of isotope-labeled d4-serine. Whereas HAP1 WT cells only formed canonical SO+3, DEGS1–/– cells exclusively formed the SO+3 isomer. Similarly, WT fibroblasts primarily formed canonical SO+3 when cultured in the presence of d4-serine, while the SO+3 isomer was formed when DEGS1 activity was inhibited with 4-HPR. (B) DEGS1–/– cells were supplemented with isotope-labeled d7SA (1 μM) or d7SO (1 μM) for 24 hours. The isomeric SO was formed only in d7SA-, but not in d7SO-supplemented cells. (C) Structural analysis of the +7-labeled isomeric SO [SOΔ(?)] after chemical derivatization with dimethyl disulfide. A specific collision fragment with m/z 110.10156 reflecting the isotope-labeled 4-carbon tail of SO+7 confirmed that the double bond of the isomeric SO isomer is in the Δ14 position.

References

    1. Hannun YA, Obeid LM. Sphingolipids and their metabolism in physiology and disease. Nat Rev Mol Cell Biol. 2018;19(3):175–191. - PMC - PubMed
    1. Hannun YA, Obeid LM. Principles of bioactive lipid signalling: lessons from sphingolipids. Nat Rev Mol Cell Biol. 2008;9(2):139–150. doi: 10.1038/nrm2329. - DOI - PubMed
    1. Bikman BT, Summers SA. Ceramides as modulators of cellular and whole-body metabolism. J Clin Invest. 2011;121(11):4222–4230. doi: 10.1172/JCI57144. - DOI - PMC - PubMed
    1. Levy M, Futerman AH. Mammalian ceramide synthases. IUBMB Life. 2010;62(5):347–356. - PMC - PubMed
    1. Ternes P, Franke S, Zähringer U, Sperling P, Heinz E. Identification and characterization of a sphingolipid delta 4-desaturase family. J Biol Chem. 2002;277(28):25512–25518. doi: 10.1074/jbc.M202947200. - DOI - PubMed

Publication types

MeSH terms