. 2019 Feb;8(3):e1801545.
doi: 10.1002/adhm.201801545. Epub 2019 Jan 8.

Atheroma Niche-Responsive Nanocarriers for Immunotherapeutic Delivery

Affiliations

Atheroma Niche-Responsive Nanocarriers for Immunotherapeutic Delivery

Erica B Peters et al. Adv Healthc Mater. 2019 Feb.

Abstract

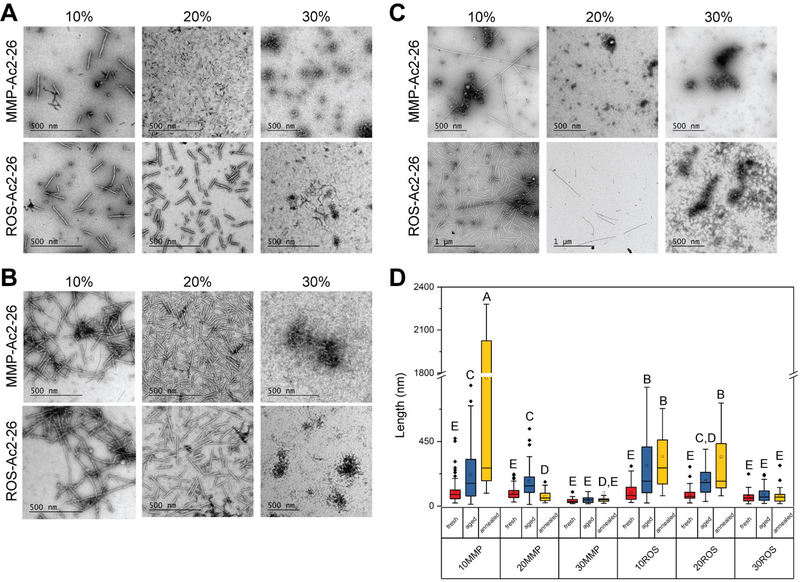
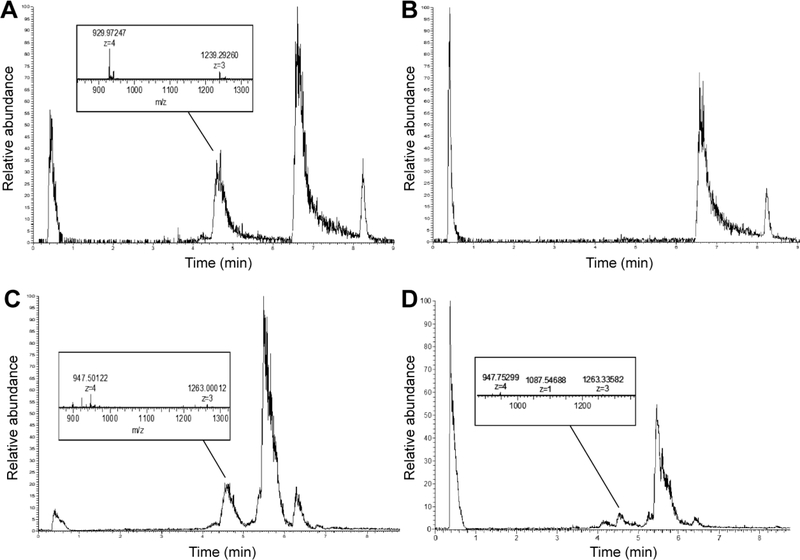
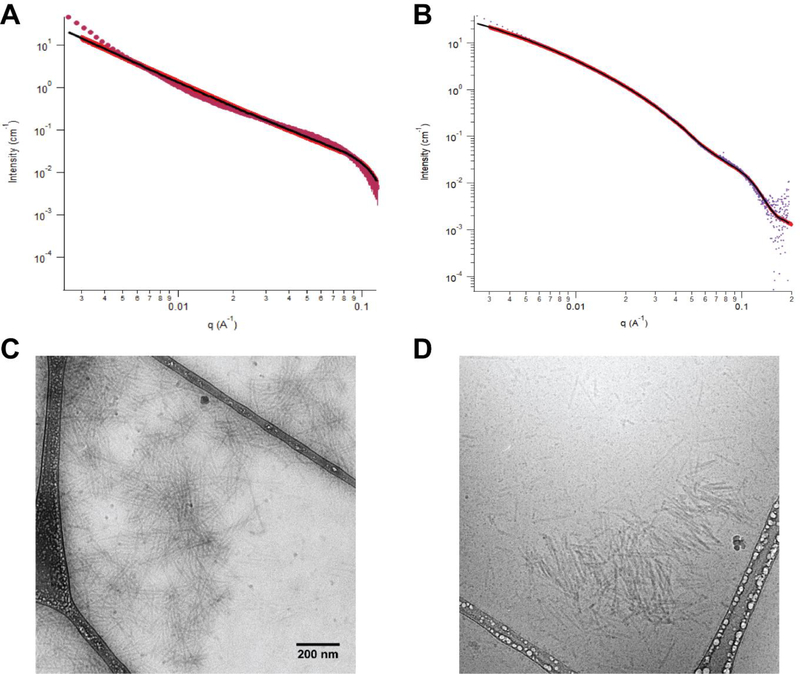
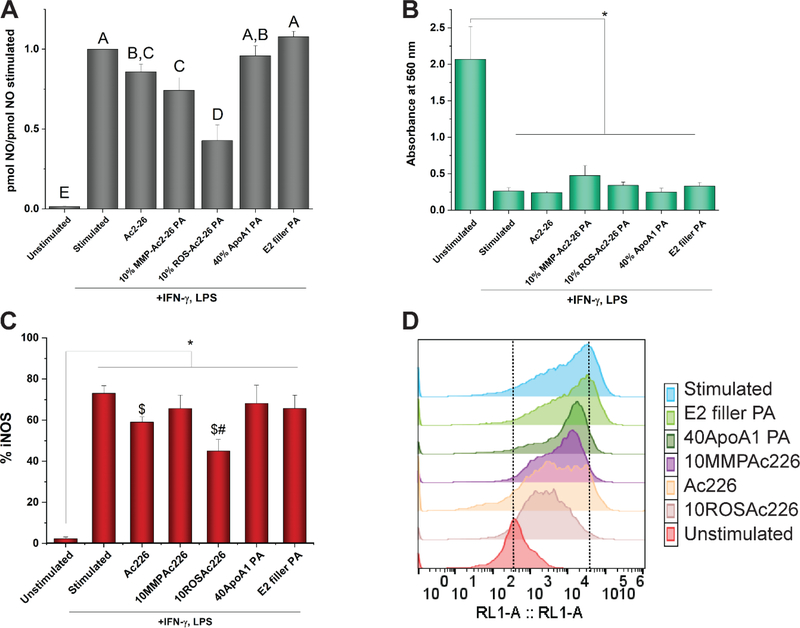
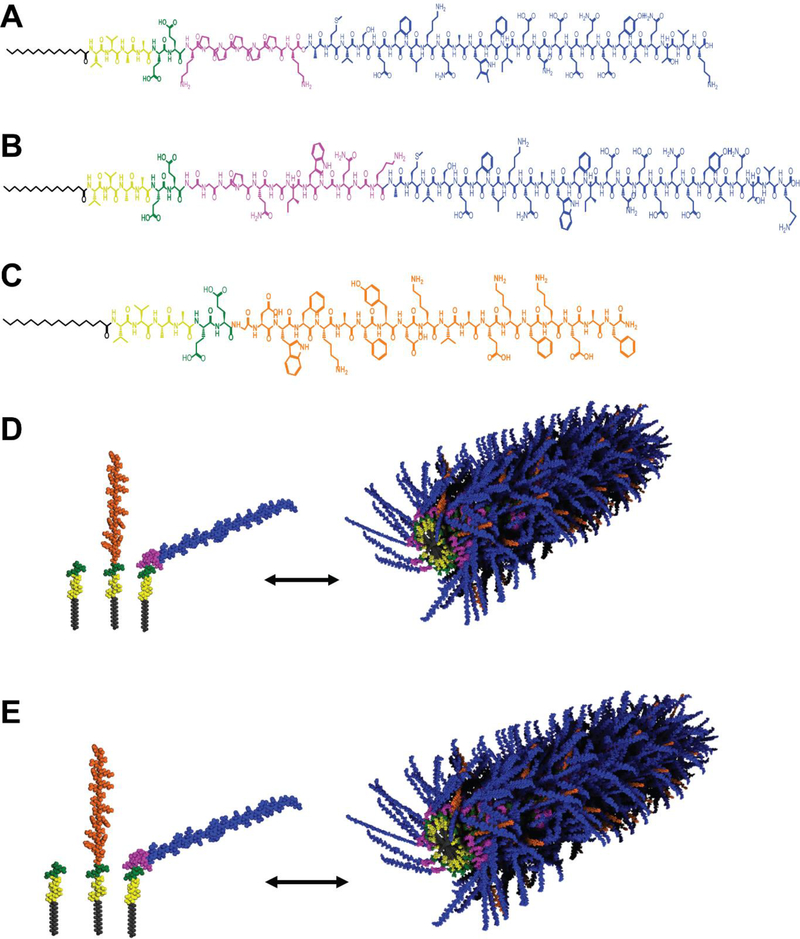
Nanomedicine is a promising, noninvasive approach to reduce atherosclerotic plaque burden. However, drug delivery is limited without the ability of nanocarriers to sense and respond to the diseased microenvironment. In this study, nanomaterials are developed from peptide amphiphiles (PAs) that respond to the increased levels of matrix metalloproteinases 2 and 9 (MMP2/9) or reactive oxygen species (ROS) found within the atherosclerotic niche. A pro-resolving therapeutic, Ac2-26, derived from annexin-A1 protein, is tethered to PAs using peptide linkages that cleave in response to MMP2/9 or ROS. By adjusting the molar ratios and processing conditions, the Ac2-26 PA can be co-assembled with a PA containing an apolipoprotein A1-mimetic peptide to create a targeted, therapeutic nanofiber (ApoA1-Ac226 PA). The ApoA1-Ac2-26 PAs demonstrate release of Ac2-26 within 24 h after treatment with MMP2 or ROS. The niche-responsive ApoA1-Ac2-26 PAs are cytocompatible and reduce macrophage activation from interferon gamma and lipopolysaccharide treatment, evidenced by decreased nitric oxide production. Interestingly, the linkage chemistry of ApoA1-Ac2-26 PAs significantly affects macrophage uptake and retention. Taken together, these findings demonstrate the potential of PAs to serve as an atheroma niche-responsive nanocarrier system to modulate the inflammatory microenvironment, with implications for atherosclerosis treatment.

Keywords: Ac2-26; atherosclerosis; drug delivery; immunotherapy; nanomedicine; peptide amphiphile.


Figures

Figure 1:
Figure 1:
Determining parameters for ApoA1-Ac2–26 PA nanofiber formation. PAs were co-assembled based upon molar ratio of the MMP- or ROS-Ac2–26 PA therapeutic with 40 mol% ApoA1 PA and the remainder as E2 filler PA. The PAs were imaged using TEM after being (A) freshly dissolved, (B) aged for 24 hours, or (C) annealed for 30 minutes at 80°C. (D) PA nanostructure length was quantified with conditions not containing the same letter significantly different, p<0.05, n ≥ 32 nanostructures analyzed per condition
Figure 2:
Figure 2:
Representative chromatographs and mass spectra indicating Ac2–26 release from PA nanofibers. (A) 10% MMP-Ac2–26 PA treated with 40 nM MMP2 for 24 hours and analyzed for a product scan of m/z=940–948. (B) 10% MMP-Ac2–26 PA without MMP2 treatment. The peak at 6.5–7 minutes contains uncleaved MMP-Ac2–26 PA and ApoA1 PA, the peak near 8.2 minutes indicates E2 filler PA (C) ROS-Ac2–26 PA treated with 100 μM SIN-1 for 24 hours and analyzed for a product scan of m/z=947–1030. (D) ROS-Ac2–26 PA without SIN-1 treatment. Uncleaved ROS-Ac2–26 PA is present in the peaks at both 5.4 and 6.5 minutes.
Figure 3:
Figure 3:
Characterization of PA structure using SAXS for (A) 10% MMP-Ac2–26 and (B) 10% ROS-Ac2–26 PAs. Plot indicates scattering intensity vs. wave vector. The solid red line represents the best fit of polydisperse core shell cylinder model form factor. The black line indicates the region where the data was fit to the model. PA stability in serum-containing solution as assessed through cryoEM for (C) 10% MMP-Ac2–26 and (D) 10% ROS-Ac2–26 PAs. Scale bar equals 200 nm, images in panel C and D are taken at the same magnification.
Figure 4:
Figure 4:
Characterization of ApoA1-Ac2–26 PA nanofibers for secondary structure through (A) circular dichroism spectroscopy and (B) zeta potential. Nile Red was used to determine the critical aggregation concentration (CAC) for (C) 10% MMP-Ac2–26 and (D) 10% ROS-Ac2–26 PAs based upon the blue shift at decreasing PA concentrations (inset).
Figure 5:
Figure 5:
Cytocompatibility and cellular uptake characterization of ApoA1-Ac2–26 PAs. (A) The effect of 24 hours of treatment with 10% MMP-Ac2–26 PA, 10% ROS-Ac2–26 PA, or Ac2–26 peptide on J774.2 macrophage viability. No significant differences (p<0.05) were observed between groups. n ≥ 3 independent experiments per condition. (B) Cellular uptake of PAs assessed by the integrated pixel density of Alexa Fluor 546-tagged PAs found within the cell. *p<0.05, #p<0.05 vs. 24 hours 10% ROS-Ac2–26 PA, ^p<0.05 vs. 24 hours 10% MMP-Ac2–26 PA. n ≥ 32 cells analyzed per condition. (C) Manders colocalization coefficient values after 24 hours of treatment with 10% ROS- or MMP-Ac2–26 PAs. M1 indicates colocalization of AF546 PA pixels vs. LAMP1 pixels, M2 indicates the reverse. *p<0.05, n ≥ 180 cells analyzed per condition. (D) Representative images of ApoA1-Ac2–26 PA colocalization to macrophages after 24 hours of treatment. Scale bar equals 20 μm.
Figure 6:
Figure 6:
Analysis of ApoA1-Ac2–26 PA effects upon macrophage activation and metabolic activity. (A) Ratio of nitric oxide (NO) production in comparison to the stimulated control. Letters not connected by the same letter are significantly different (p<0.05). n ≥ 7 independent experiments for each condition. Error bars indicate S.E.M. (B) Cellular metabolic activity measured by an MTT assay using absorbance at 560 nm. n=3 per condition. *p<0.05. (C) Percentage of cells expressing iNOS assayed by flow cytometry. *p<0.05, $p<0.05 vs. Stimulated, #p<0.05 vs. 40ApoA1 PA, n ≥ 4 per condition. (D) Representative histogram for effect of PA and peptide treatments upon iNOS expression. RL1-A indicates the APC channel used to measure fluorescence. The dotted lines indicate reference peak values for unstimulated and stimulated conditions.
Schematic 1.
Schematic 1.
Chemical structures of (A) ROS-Ac2–26 PA, (B) MMP-Ac2–26 PA, and (C) ApoA1 PA. Molecular graphics of (D) ROS-Ac2–26-ApoA1 PA or (E) MMP-Ac2–26-ApoA1 PA nanofibers formed by self-assembly of three PAs: the PA backbone (E2 filler PA) containing an alkyl tail (gray), β-sheet forming peptide sequence (yellow), and charged region to enhance solubility (green); ApoA1 PA with 4F peptide (orange), and PAs with pro-resolving Ac2–26 (blue) attached with a ROS- or MMP2/9-cleavable linkage (pink)

References

    1. Benjamin EJ, Blaha MJ, Chiuve SE, Cushman M, Das SR, Deo R, De Ferranti SD, Floyd J, Fornage M, Gillespie C, Isasi CR, Jim’nez MC, Jordan LC, Judd SE, Lackland D, Lichtman JH, Lisabeth L, Liu S, Longenecker CT, MacKey RH, Matsushita K, Mozaffarian D, Mussolino ME, Nasir K, Neumar RW, Palaniappan L, Pandey DK, Thiagarajan RR, Reeves MJ, Ritchey M, Rodriguez CJ, Roth GA, Rosamond WD, Sasson C, Towfghi A, Tsao CW, Turner MB, Virani SS, Voeks JH, Willey JZ, Wilkins JT, Wu JHY, Alger HM, Wong SS, Muntner P, Circulation 2017, 135, e146. - PMC - PubMed
    1. Frostegård J, BMC Med. 2013, 11, DOI 10.1186/1741-7015-11-117. - DOI - PMC - PubMed
    1. Ross R, N. Engl. J. Med 1999, 340, 115. - PubMed
    1. Tabas I, García-Cardeña G, Owens GK, J. Cell Biol 2015, 209, 13. - PMC - PubMed
    1. Tabas I, Nat. Rev. Immunol 2010, 10, 36. - PMC - PubMed

Publication types

MeSH terms