. 2019 Mar 1;129(3):1180-1192.
doi: 10.1172/JCI122694. Epub 2019 Feb 11.

Single-nucleotide human disease mutation inactivates a blood-regenerative GATA2 enhancer

Affiliations

Single-nucleotide human disease mutation inactivates a blood-regenerative GATA2 enhancer

Alexandra A Soukup et al. J Clin Invest. .

Abstract

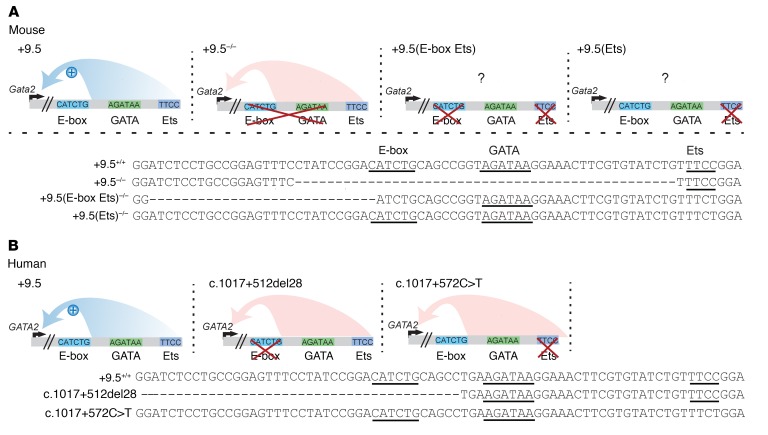
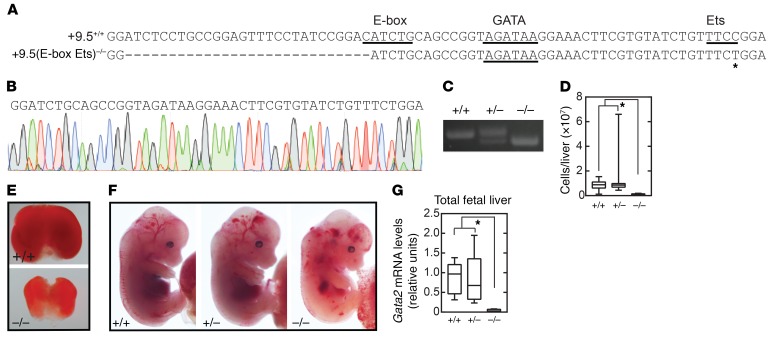
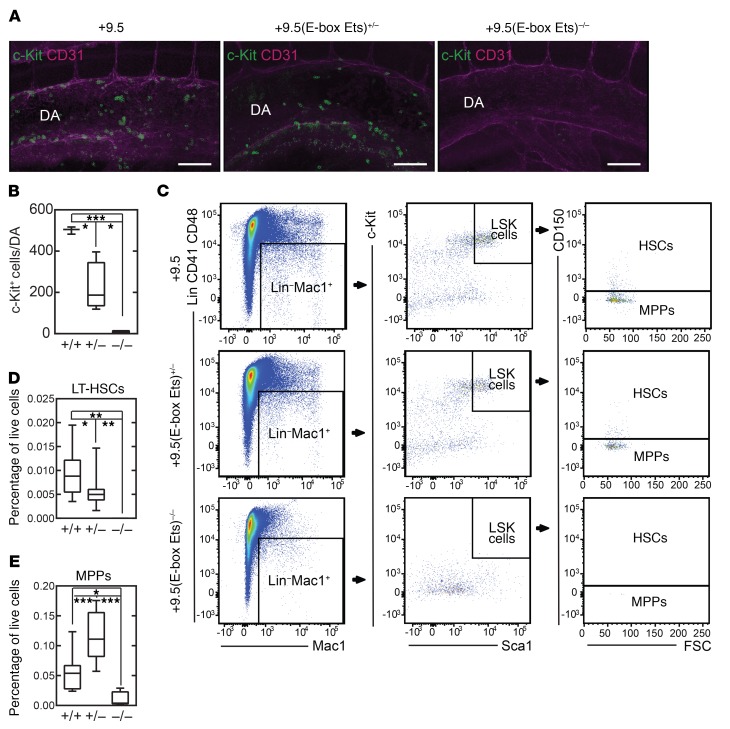
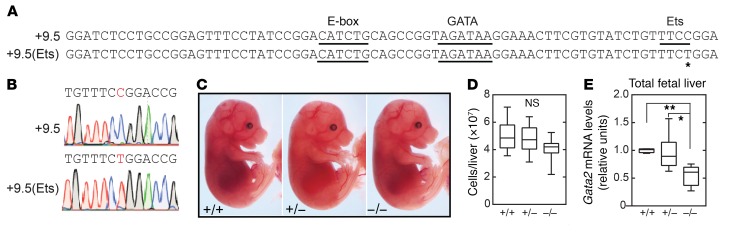
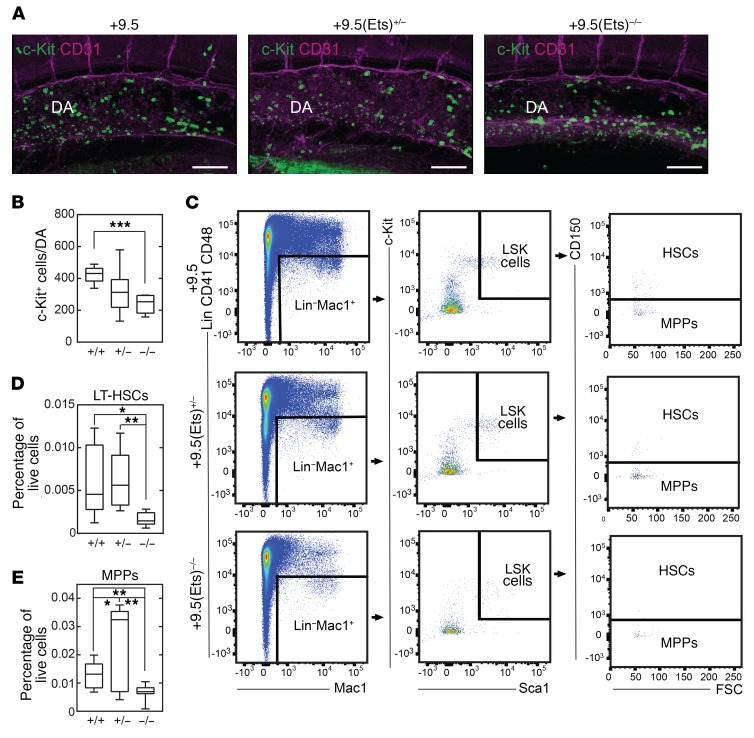
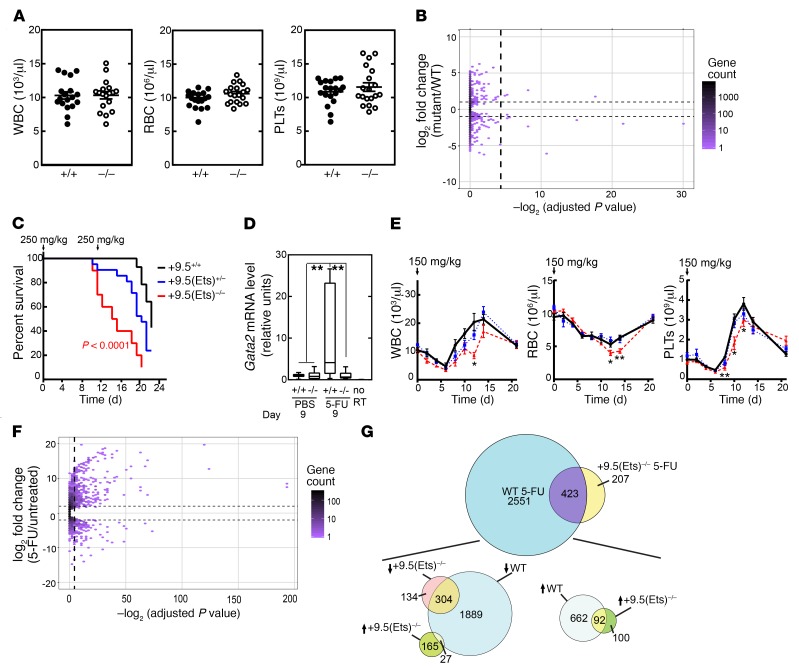
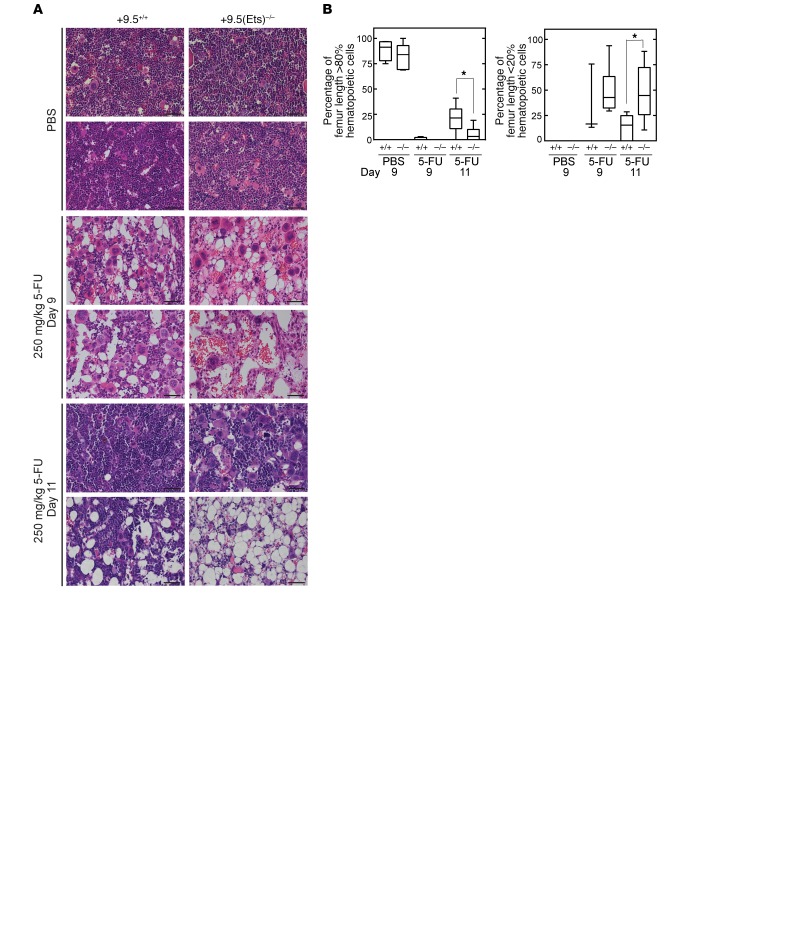
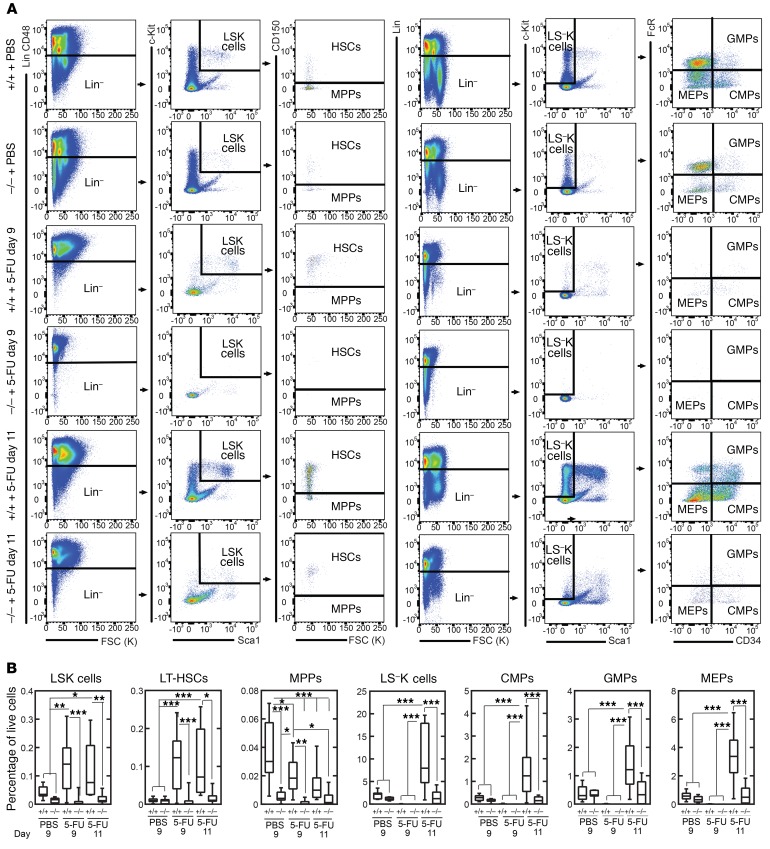
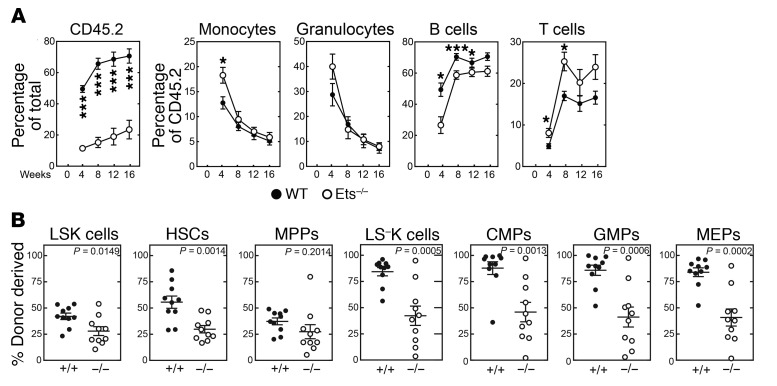
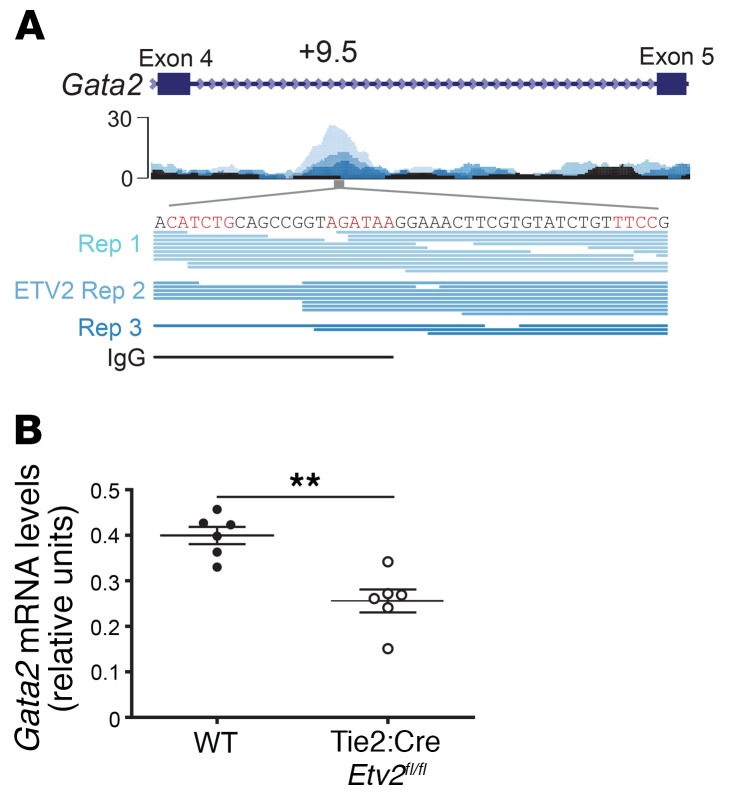
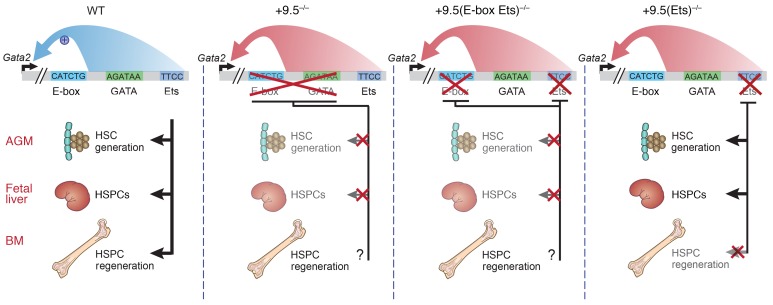
The development and function of stem and progenitor cells that produce blood cells are vital in physiology. GATA-binding protein 2 (GATA2) mutations cause GATA-2 deficiency syndrome involving immunodeficiency, myelodysplastic syndrome, and acute myeloid leukemia. GATA-2 physiological activities necessitate that it be strictly regulated, and cell type-specific enhancers fulfill this role. The +9.5 intronic enhancer harbors multiple conserved cis-elements, and germline mutations of these cis-elements are pathogenic in humans. Since mechanisms underlying how GATA2 enhancer disease mutations impact hematopoiesis and pathology are unclear, we generated mouse models of the enhancer mutations. While a multi-motif mutant was embryonically lethal, a single-nucleotide Ets motif mutant was viable, and steady-state hematopoiesis was normal. However, the Ets motif mutation abrogated stem/progenitor cell regeneration following stress. These results reveal a new mechanism in human genetics, in which a disease predisposition mutation inactivates enhancer regenerative activity, while sparing developmental activity. Mutational sensitization to stress that instigates hematopoietic failure constitutes a paradigm for GATA-2 deficiency syndrome and other contexts of GATA-2-dependent pathogenesis.

Keywords: Bone marrow differentiation; Hematology; Hematopoietic stem cells; Mouse models; Stem cells.


Conflict of interest statement

Conflict of interest: The authors have declared that no conflict of interest exists.

Figures

Figure 1
Figure 1. The +9.5 enhancer WGATAR motif is insufficient for HSC genesis and function.
(A) Mouse +9.5 mutations. Deletion of the E-box spacer GATA composite elements abrogates +9.5 function (2). The question marks denote uncertainty regarding whether the mutation impacts protein occupancy at adjacent sites. (B) Human +9.5 mutations found in patients with GATA-2 deficiency syndrome (2, 9).
Figure 2
Figure 2. The +9.5 enhancer WGATAR motif is insufficient for embryogenesis.
(A) Sequences of WT (+9.5+/+) and E-box Ets–mutant [+9.5(E-box Ets)–/–] mice. (B) Sequence of mutant mice. (C) PCR genotyping. (D) Quantification of E13.5 liver cells from +9.5(E-box Ets+/+) (n = 11), +9.5(E-box Ets)+/– (n = 30), and +9.5(E-box Ets)–/– (n = 6) mice. Data are from 5 experiments. (E) E13.5 fetal livers from littermate mice. (F) E13.5 littermates with anemia, hemorrhage, and edema. (G) Gata2 mRNA quantification of fetal liver cells from +9.5(E-box Ets)+/+ (n = 5), +9.5(E-box Ets)+/– (n = 9), and +9.5(E-box Ets)–/– (n = 4) mice. Data are from 3 experiments. Quantitative data are represented as box-and-whisker plots, with bounds from the 25th to 75th percentiles, the median line, and whiskers ranging from minimum to maximum values. *P < 0.05, by 2-tailed, unpaired Student’s t test with Benjamini-Hochberg correction.
Figure 3
Figure 3. The +9.5 enhancer WGATAR motif is insufficient for HSC genesis and function.
(A) Whole-mount immunostaining of E10.5 dorsal aorta (DA). CD31+ cells are shown in magenta and c-Kit+ cells in green. Scale bars: 100 μm. (B) c-Kit+ cell quantification within the dorsal aorta from +9.5(E-box Ets)+/+ (n = 3), +9.5(E-box Ets)+/– (n = 4), and +9.5(E-box Ets)–/– (n = 4) mice. Data are from 2 experiments. (C) Flow cytometric analysis of E13.5 fetal liver HSCs (LinCD41CD48Mac1+Sca1+Kit+CD150+) and MPPs (LinCD41CD48Mac1+Sca1+Kit+CD150). FSC, forward scatter. (D and E) HSC and MPP quantification (percentage of live fetal liver cells from +9.5(E-box Ets)+/+ (n = 12), +9.5(E-box Ets)+/– (n = 19), and +9.5(E-box Ets)–/– (n = 4) mice. Data are from 3 experiments. Quantitative data are represented as box-and-whisker plots, with bounds from the 25th to 75th percentiles, the median line, and whiskers ranging from minimum to maximum values. *P < 0.05, **P < 0.01, and ***P < 0.001, by 2-tailed, unpaired Student’s t test with Benjamini-Hochberg correction.
Figure 4
Figure 4. The +9.5 enhancer Ets motif is dispensable for HSC emergence.
(A) Sequences of WT [+9.5(Ets)+/+] and Ets motif-mutant [+9.5(Ets)–/–] embryos. Asterisk indicates C>T transition. (B) Sequences of +9.5+/+ and +9.5(Ets)–/– animals. (C) E15.5 littermates. (D) Quantification of E15.5 liver cells from +9.5+/+ (n = 18), +9.5(Ets)+/– (n = 20), and +9.5(Ets)–/– (n = 10) embryos. Data are from 4 experiments. (E) Gata2 mRNA quantification in fetal liver cells from +9.5(Ets)+/+ (n = 4), +9.5(Ets)+/– (n = 7), and +9.5(Ets)–/– (n = 5) embryos. Data are from 2 experiments. Quantitative data are represented as box-and-whisker plots, with bounds from the 25th to 75th percentiles, the median line, and whiskers ranging from minimum to maximum values. *P < 0.05 and **P < 0.01, by 2-tailed, unpaired Student’s t test with Benjamini-Hochberg correction.
Figure 5
Figure 5. The +9.5 enhancer Ets motif is dispensable for HSC emergence.
(A) Whole-mount immunostaining of E10.5 dorsal aorta. CD31+ cells are shown in magenta and c-Kit+ cells in green. Scale bars: 100 μm. (B) c-Kit+ cell quantification within the dorsal aorta from +9.5+/+ (n = 6), +9.5(Ets)+/– (n = 8), and +9.5(Ets)–/– (n = 6) mice. Data are from 4 experiments. (C) Flow cytometric analysis of E15.5 fetal liver HSCs (LinCD41CD48Mac1+Sca1+Kit+CD150+) and MPPs (LinCD41CD48Mac1+Sca1+Kit+CD150). (D and E) Quantification of HSCs and MPPs (percentage of live fetal liver cells) from +9.5(Ets)+/+ (n = 9), +9.5(Ets)+/– (n = 11), and +9.5(Ets)–/– (n = 8) mice. Data are from 2 experiments. Quantitative data are represented as box-and-whisker plots, with bounds from the 25th to 75th percentiles, the median line, and whiskers ranging from minimum to maximum values; *P < 0.05, **P < 0.01, and ***P < 0.001, by 2-tailed, unpaired Student’s t test with Benjamini-Hochberg correction.
Figure 6
Figure 6. The +9.5 enhancer Ets motif confers hematopoietic regeneration and survival following stress.
(A) Steady-state peripheral blood parameters (n = 18 per genotype). (B) MA plot summarizing RNA-Seq analysis of transcripts from BM-derived WT and +9.5(Ets)–/– LSK cells in the steady state. (C) Kaplan-Meier survival curve for mice following two 5-FU doses (250 mg/kg, days 0 and 11): +9.5+/+ (n = 17), +9.5(Ets)+/– (n = 23), and +9.5(Ets)–/– (n = 10). Data are from 2 experiments. Significance was determined using the log-rank test. (D) qRT-PCR quantitation of mRNA from BM 9 days after vehicle (PBS) or 5-FU (250 mg/kg) treatment of +9.5+/+ (n = 8) and +9.5(Ets)–/– (n = 8) mice. Data are from 4 experiments. Quantitative data are represented as box-and-whisker plots, with bounds from the 25th to 75th percentiles, the median line, and whiskers ranging from minimum to maximum values. **P < 0.01, by Tukey’s multiple comparisons test. (E) Hematologic parameters following 5-FU treatment (150 mg/kg). n = 9 per genotype; data are from 3 experiments. (F) MA plot summarizing RNA-Seq analysis of transcripts from BM-derived WT and +9.5(Ets)–/– LSK cells on day 10 after treatment with 5-FU. (G) Relationships derived from the RNA-Seq data in F. Venn diagram compares 5-FU–regulated (total upregulated and downregulated) transcripts in BM-derived WT and +9.5(Ets)–/– LSK cells on day 10 after 5-FU treatment. These relationships were further deconvoluted by separating 5-FU–upregulated transcripts from the downregulated transcripts. PLTs, platelets.
Figure 7
Figure 7. The +9.5 enhancer Ets motif promotes hematopoietic regeneration after stress.
(A) H&E staining of BM after treatment with vehicle (PBS) or 9 or 11 days after treatment with 5-FU (250 mg/kg). Scale bars: 50 μm. (B) Quantification of BM cells as shown in A. n = 4 per genotype and condition; data are from 4 experiments. Quantitative data are represented as box-and-whisker plots, with bounds from the 25th to 75th percentiles, the median line, and whiskers ranging from minimum to maximum values. *P < 0.05, by 2-tailed, unpaired Student’s t test with Benjamini-Hochberg correction.
Figure 8
Figure 8. +9.5 enhancer Ets motif–dependent HSPC regeneration.
BM was harvested 9 or 11 days after vehicle (PBS) or 5-FU (250 mg/kg) treatment. (A) Flow cytometric analysis of LSK cells (LinCD48Sca1+Kit+), HSCs (LinCD48Sca1+Kit+CD150+), MPPs (LinCD48Sca1+Kit+CD150), LSK cells (LinSca1Kit+), MEPs (LinSca1Kit+FcγRCD34), CMPs (LinSca1Kit+FcγRCD34+), and GMPs (LinSca1Kit+FcγR+CD34+). (B) LSK, HSC, MPP, LSK, MEP, CMP, and GMP quantification (percentage of live BM cells). n = 8–10 per genotype and treatment; data are from 5 experiments. Quantitative data are represented as box-and-whisker plots, with bounds from the 25th to 75th percentiles, the median line, and whiskers ranging from minimum to maximum values. *P < 0.05, **P < 0.01, and ***P < 0.001, by Tukey’s multiple comparisons test.
Figure 9
Figure 9. +9.5 enhancer Ets motif–dependent regeneration of LT-HSCs.
(A) Multilineage repopulating activity 16 weeks after competitive transplantation (n = 10 per genotype). *P < 0.05 and ***P < 0.001, by 2-tailed, unpaired Student’s t test. (B) Analysis of donor-derived LSK cells, HSCs, MPPs, LSK cells, CMPs, GMPs, and MEPs in BM 16 weeks after competitive transplantation (n = 10 per genotype). Statistical significance was determined by 2-tailed, unpaired Student’s t test.
Figure 10
Figure 10. Evidence for an ETV2/GATA-2 regenerative axis.
(A) ETV2 ChIP-Seq. ETV2 occupancy was detected at the +9.5 enhancer in mouse embryonic stem cell–derived embryoid bodies (GEO GSE59402) (41). (B) Sorted LSK cells from WT (n = 6) or Tie2-Cre Etv2 conditional–knockout mice (n = 6) 10 days after 5-FU injection (250 mg/kg). Gata2 mRNA levels were normalized to Actb. **P < 0.01, by 2-tailed, unpaired Student’s t test.
Figure 11
Figure 11. Human disease predisposition mutation segregates developmental versus regenerative enhancer functions.
Model depicts the +9.5(E-box Ets)–/– HSC emergence and fetal liver hematopoietic defects, which phenocopy the previously described +9.5–/– phenotype. Both mutations are embryonically lethal. In contrast, the human disease +9.5 Ets motif mutant is not an embryonically lethal mutation. In adult mice, the mutation impedes HSPC regeneration. We propose that the human mutation renders the hematopoietic system vulnerable to subsequent insults that demand HSPC regeneration to reestablish the steady state. The intimate connection between the predisposition mutation and mechanisms elicited by secondary insults may underlie the variable penetrance of disease onset in GATA-2 deficiency syndrome.

References

    1. Gao X, et al. Gata2 cis-element is required for hematopoietic stem cell generation in the mammalian embryo. J Exp Med. 2013;210(13):2833–2842. doi: 10.1084/jem.20130733. - DOI - PMC - PubMed
    1. Johnson KD, et al. Cis-element mutated in GATA2-dependent immunodeficiency governs hematopoiesis and vascular integrity. J Clin Invest. 2012;122(10):3692–3704. doi: 10.1172/JCI61623. - DOI - PMC - PubMed
    1. Linnemann AK, O’Geen H, Keles S, Farnham PJ, Bresnick EH. Genetic framework for GATA factor function in vascular biology. Proc Natl Acad Sci U S A. 2011;108(33):13641–13646. doi: 10.1073/pnas.1108440108. - DOI - PMC - PubMed
    1. Mehta C, et al. Integrating Enhancer Mechanisms to Establish a Hierarchical Blood Development Program. Cell Rep. 2017;20(12):2966–2979. doi: 10.1016/j.celrep.2017.08.090. - DOI - PMC - PubMed
    1. Johnson KD, et al. Cis-regulatory mechanisms governing stem and progenitor cell transitions. Sci Adv. 2015;1(8):e1500503. doi: 10.1126/sciadv.1500503. - DOI - PMC - PubMed

Publication types

Substances