. 2019 Jan 7;48(1):49-63.e7.
doi: 10.1016/j.devcel.2018.11.048.

Neurog3-Independent Methylation Is the Earliest Detectable Mark Distinguishing Pancreatic Progenitor Identity

Affiliations

Neurog3-Independent Methylation Is the Earliest Detectable Mark Distinguishing Pancreatic Progenitor Identity

Jing Liu et al. Dev Cell. .

Abstract

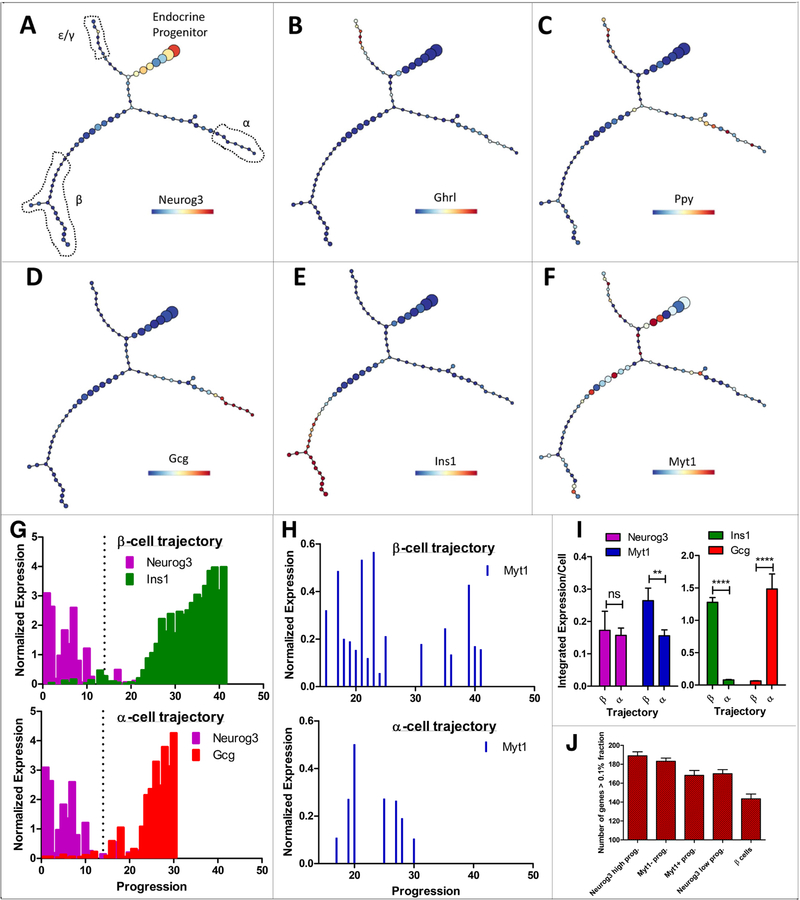
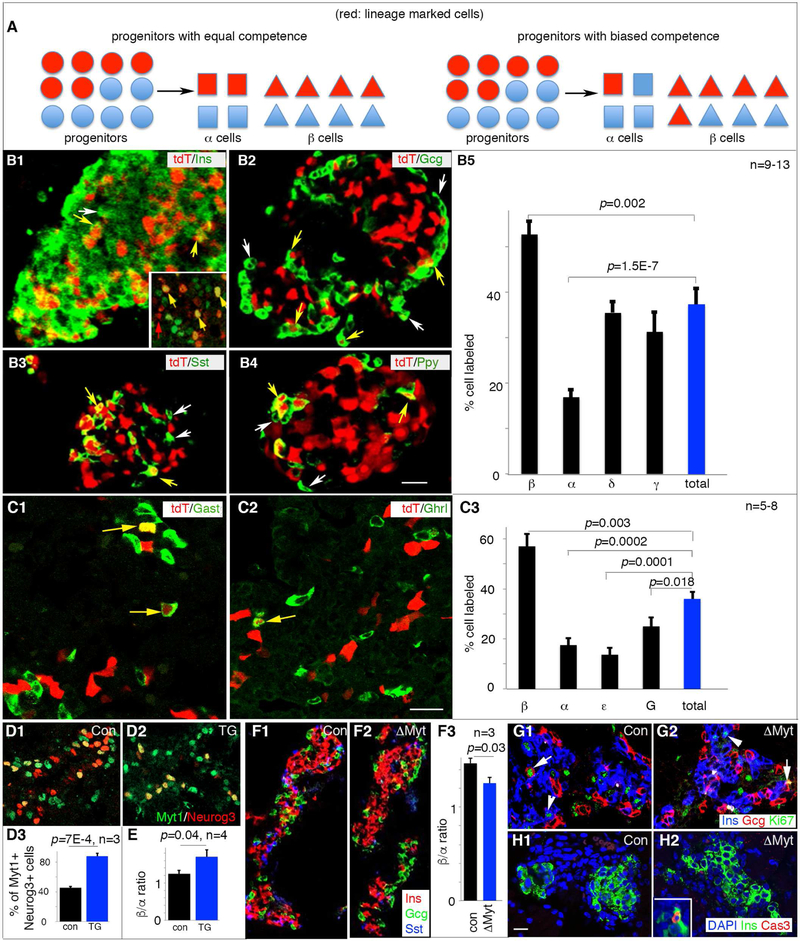
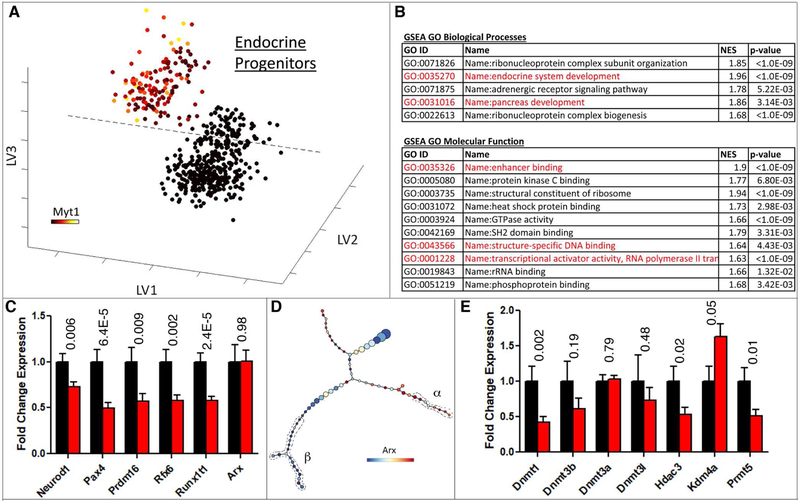
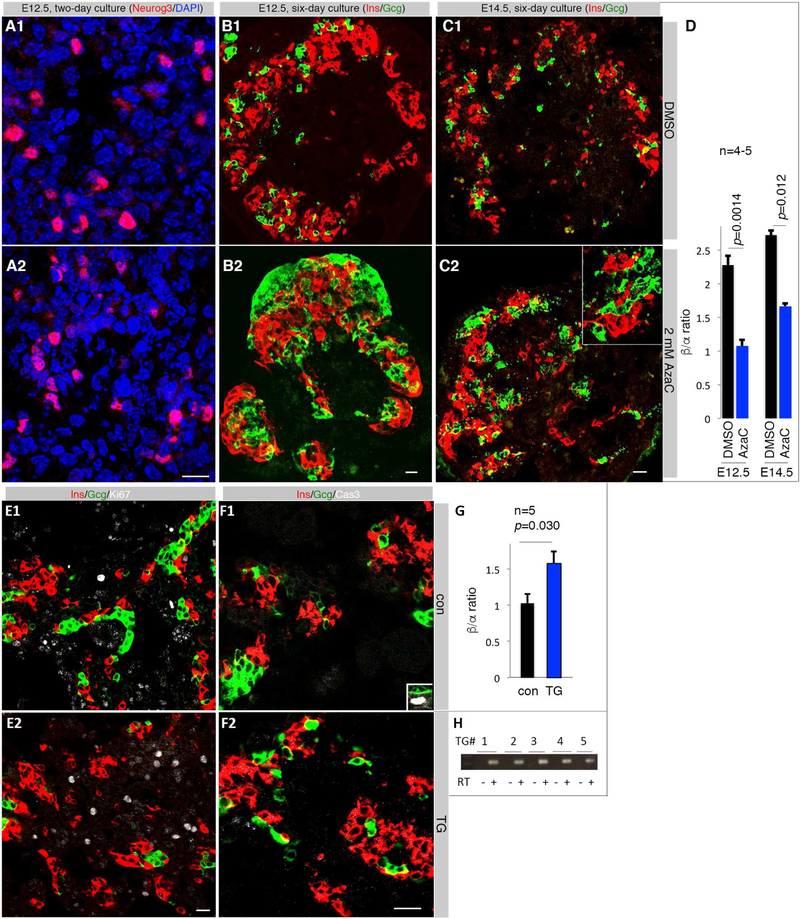
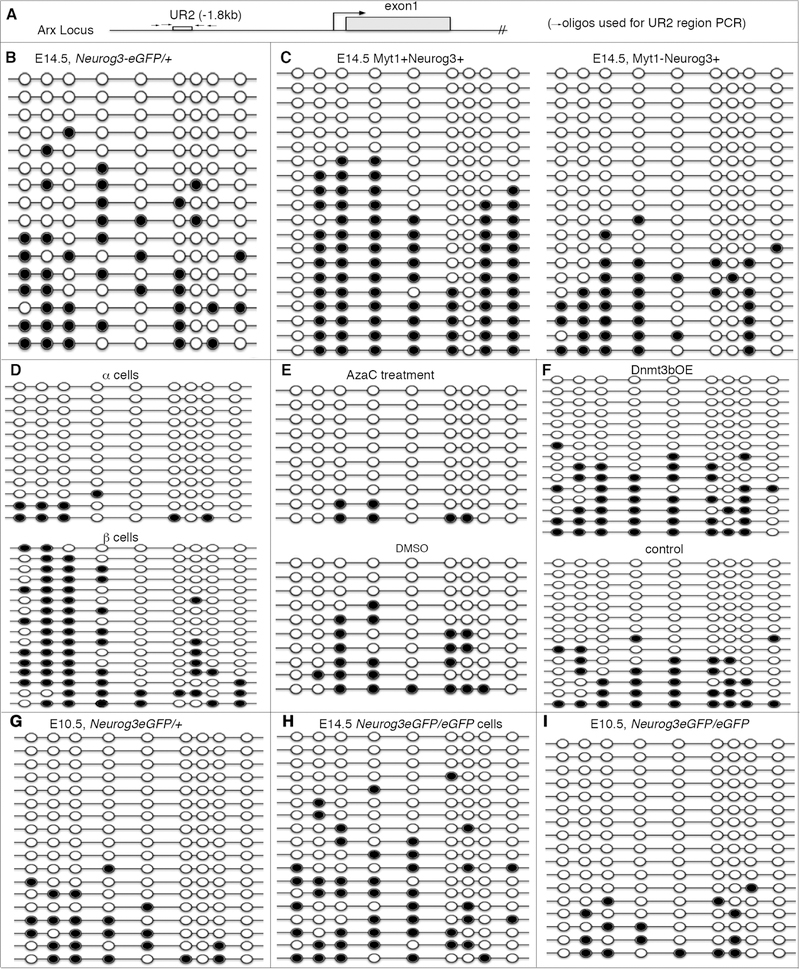
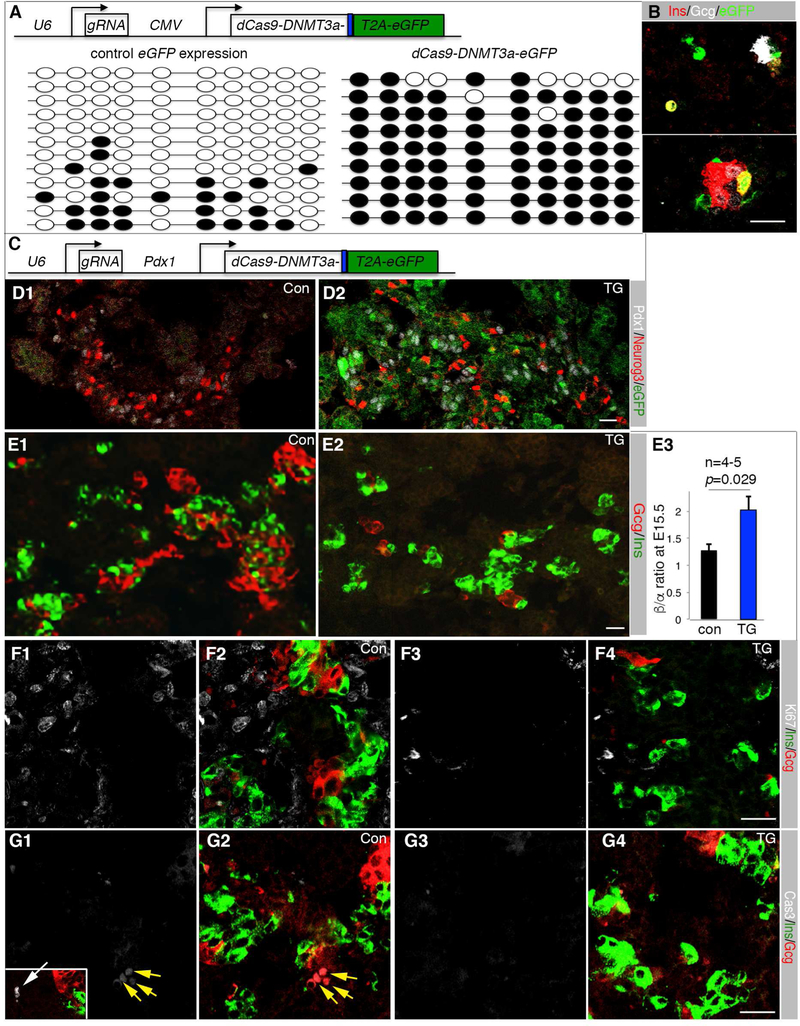
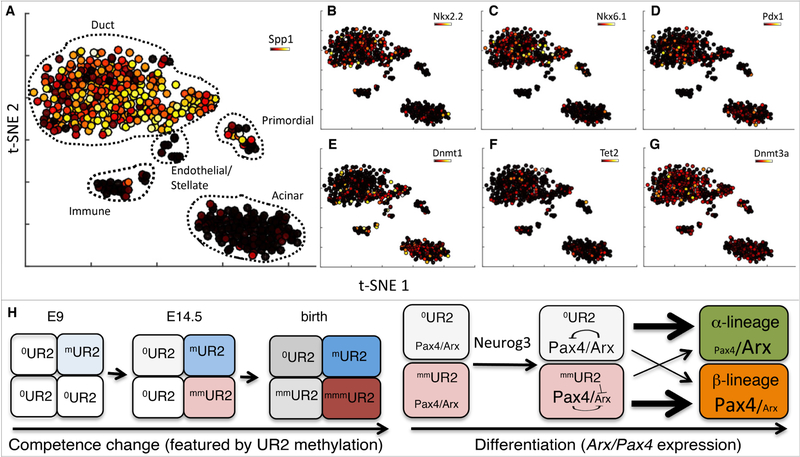
In the developing pancreas, transient Neurog3-expressing progenitors give rise to four major islet cell types: α, β, δ, and γ; when and how the Neurog3+ cells choose cell fate is unknown. Using single-cell RNA-seq, trajectory analysis, and combinatorial lineage tracing, we showed here that the Neurog3+ cells co-expressing Myt1 (i.e., Myt1+Neurog3+) were biased toward β cell fate, while those not simultaneously expressing Myt1 (Myt1-Neurog3+) favored α fate. Myt1 manipulation only marginally affected α versus β cell specification, suggesting Myt1 as a marker but not determinant for islet-cell-type specification. The Myt1+Neurog3+ cells displayed higher Dnmt1 expression and enhancer methylation at Arx, an α-fate-promoting gene. Inhibiting Dnmts in pancreatic progenitors promoted α cell specification, while Dnmt1 overexpression or Arx enhancer hypermethylation favored β cell production. Moreover, the pancreatic progenitors contained distinct Arx enhancer methylation states without transcriptionally definable sub-populations, a phenotype independent of Neurog3 activity. These data suggest that Neurog3-independent methylation on fate-determining gene enhancers specifies distinct endocrine-cell programs.

Keywords: Arx; DMR; DNA methylation; DNMT; HMR; Myt1; azacytidine; combinatorial lineage tracing; diabetes; epigenetics; glucagon; insulin; lineage priming; p-Creode; pseudotime; single-cell RNA-seq; specification; stochastic gene expression; trajectory; transcriptional noise; α cell; β cell.


Conflict of interest statement

Declarations of Interests:

The authors declare no competing interests.

Figures

Figure 1.
Figure 1.. Single-cell gene expression projects Myt1-expressing endocrine progenitors preferentially towards the β-cell fate.
(A-F) p-Creode trajectory analysis of scRNA-seq data from E14.5 PPCs depicting α-, β-, ε-, and γ-cell differentiation from Neurog3+ progenitors. Overlays represent gene expression levels on a variance normalized (Asinh) scale. Shown are representative graphs from N=100 resampled runs on n=2 biological replicates. (G) Expression of Neurog3, Ins1, and Gcg plotted as a function of progression on p-Creode trajectories in A. X-axis represents cell states traversed from progenitor to differentiated cell states. Y-axis represents gene expression levels on a variance normalized (Asinh) scale. Dotted lines represent the bifurcation point from a common progenitor (left) and cells projecting into β- (top) or α-branches (bottom) (right). (H) Myt1 expression in β- (top, 306 cells) and α- (bottom, 114 cells) trajectory as they exit the common progenitor pool and progress toward β- and α-cell fates. (I) Integrated expression of selected markers in cells of α- or β-biased trajectories, presented as per cell levels only including cells after the bifurcation point. Error bars, SEM from n=5 p-Creode trajectories generated by resampled runs. ** p<0.01, **** p<0.0001 by t-test. (J) Number of genes expressed in different sub-cell populations at high levels. Only genes with levels >0.1% of the total transcripts were counted. Error bars, SEM. Also see Figure S1 and Table S1.
Figure 2.
Figure 2.. The Myt1+Neurog3+ progenitors are biased toward β-cell fate with Myt1 serving marginal instructive roles.
For all panels with quantification, marked p-values were from t-Test. (A) Diagrammatic explanation of the quantification process. The Myt1+Neurog3+ islet progenitors cells were marked as red (tdT). If the Myt1+ (red dots) and Myt1- (blue dots) Neurog3+ progenitors have equal competence, we expect the portion of each islet cell type expressing tdT to be equal (left half of panel A). If the Myt1+Neurog3+ progenitors are biased toward one cell fate, e.g., β-cell fate, the portion of tdT+ β cells will be over-represented. (B1-5) Hormone staining of tdT+ islets and quantification of tdT+ islet cell types at P1. White arrows, hormone-tdT+ cells. Yellow arrows, hormone+tdT+ cells. Inset in B1, Pdx1 staining in several tdT+ cells. Scale bar, 20 μm. Panel B5 showed (mean + SEM). (C1-3) Hormone staining in tdT+ islets and quantification at E16.5. Yellow arrows, hormone+tdT+ cells. Scale bar, 20 μm. Panel C3 showed (mean + SEM). (D1-3) Myt1-Neurog3 co-expression in Neurog3Myt1OE transgenic (TG) mice at E14.5. Panel D3 showed (mean + SEM). (E) β/α cell ratio in E16.5 control and TG pancreata, presented as (mean + SEM). (F1-3) Ins/Gcg/Sst staining and quantification of β/α cell ratio in E16.5 islets of control and ΔMyt pancreata. (G, H) Ki67 (G) and cleaved-Cas3 (H) labeling of islet cells in E16.5 control or ΔMyt pancreata. Note the cycling Gcg+ or Ins+ cells in both control (G1) and mutant islets (G2) (arrows and arrowheads, respectively). Inset in H2, positive control for Cas3 staining. Images from D-H used identical scales, with bar in H1=20 μm. Also see Figure S2 and Table S3.
Figure 3.
Figure 3.. Epigenetic and DNA methylation processes are enriched in Myt1+ endocrine progenitors.
(A) PLSDA of scRNA-Seq data to identify Myt1+ against Myt1- endocrine progenitors. X,Y,Z axes are the latent variables generated by PLSDA. Overlays represent Myt1 expression levels on a variance normalized (Asinh) scale. (B) GO term enrichment analysis of genes upregulated in Myt1+ endocrine progenitor cells compared with Myt1-cells. Highlighted terms in red are of interest to this study. (C) Relative expression of elected TF genes in Myt1+ (black) and Myt1-(red) endocrine progenitor cells. Error bars represent SEM from n³150 cells. (D) Arx expression overlaid on p-Creode trajectory in Figure 1. Cells with recognizable β- and α-cell features were circled. (E) Relative epigenetic genes expression in Myt1+ (black) and Myt1-(red) endocrine progenitor cells. Error bars represent SEM from n≥151 cells. In panels C and E, p-values (t-Test) were placed on top of each gene. Also see Figure S3.
Figure 4.
Figure 4.. Manipulating DNA methylation promotes α-cell differentiation.
Scale bars = 20 μm for all images. (A) Neurog3 staining in E12.5 pancreatic buds two days after culture. (B, C) Ins and Gcg expression after 6 days in culture of E12.5 and E14.5 pancreata. Inset in C2 is an enlarged region showing the lack of overlapping between Ins and Gcg immunosignals. (D) Quantification of β/α cell ratios. Error bars are SEM. Marked p-values were from t-test. (E) Co-staining for Ins, Gcg, and Ki67 in E15.5 control and a Pdx1DNMT1 TG pancreata. (F) Co-staining for Ins, Gcg, and activated Caspase 3 (Cas3). Inset in F1 showed a Cas3+ cells in the duct, serving as control. (G) Quantification of β/α cell ratios in five independent Pdx1DNMT1 transgenic pancreata. Error bars are SEM. Presented p-value was from t-Test. (H) RT-PCR detection of DNMT1 mRNA in transgenic pancreatic cells. Also see Figure S4 and S4.
Figure 5.
Figure 5.. High methylation in the UR2 enhancer of Arx in PPCs correlates with the production of β cells.
In all panels, black and open circles indicated methylated or non-methylated CpG dinucleotides, respectively. (A) A diagram showing the location of UR2 in Arx. (B-I) UR2 methylation in different cell populations, the eGFP+ cells of E14.5 Neurog3eGFP/+ pancreata (B), E14.5 Myt1+Neurog3+ and Myt1-Neurog3+ cells (C), purified E16.5 α and β cells (D); AzaC treated and control Neurog3eGFP/+ cells (E); Neurog3eGFP+ cells with or without Dnmt3b overexpression (F); E10.5 Neurog3eGFP + heterozygous cells (G); Neurog3-transcribing cells of E14.5 Neurog3eGFP/eGFP null pancreas (H), and E10.5 Neurog3-transcribing Neurog3eGFP/eGFP null cells (I). Also see Figure S5, S6 and Table S2.
Figure 6.
Figure 6.. UR2 hyper-methylation promotes β-cell production.
(A) The top depicts the DNA construct electroporated into E12.5 pancreatic cells. eGFP+ cells were sorted after three-day hang-drop culture and used for UR2 methylation assays (bottom). Dark circles indicated methylated CpG dinucleotide. (B) Ins/Gcg expression status of electroporated pancreatic cells 4-days after hang-drop culture. (C) The DNA construct used for transgenic (TG) mouse derivation. dCas9 and the DNMT3a activation domain were produced as a fusion protein. eGFP was produced as a separate protein via a T2A peptide. (D) Neurog3 and eGFP expression in E15.5 control (con) and TG pancreatic sections. (E) Ins/Gcg staining and quantification. The p-value in C3 is from t-Test. Error bars in E3 represent SEM. (F) Ki67 detection in E15.5 Ins+ or Gcg+ cells. F1 and F2, control sections. F3 and F4, TG sections. Note that single Ki67 (F1, F3) and merged Ki67, Ins, Gcg channels (F2, F4) were shown. (G) Same as F, except activated Cas3 was assayed. Inset in G1 is a Cas3+ cell (white arrow). Scale bars in all panels, 20 μm. Also see Table S3.
Figure 7:
Figure 7:. Epigenetic, but not transcriptional, heterogeneity was detected in endo-ready PPCs.
(A) t-SNE analysis of scRNA-seq data generated from E14.5 Neurog3eGFP/eGFP cells overlaid with the duct marker Spp1. Cell populations expressing characteristic markers are labeled. (B-G) Overlays of several genes over the t-SNE map in A. Overlays represent gene expression levels on a variance normalized (Asinh) scale. (H) A model to explain the temporal competence changes in PPCs (left) and the derivation of multiple islet cell types (right). Rectangles of different color represent cells of different competence state. The number of “m” next to “UR2” indicates the degree of UR2 methylation, which increases over embryogenesis under the influence of maybe Dnmts/Tets. This methylation increase changes the temporal competence of the PPCs. UR2 methylation is asynchronous, producing PPCs with different levels of methylation. If a PPC has no/low levels of UR methylation, it can activate both Arx and Pax4 upon high Neurog3 production. High levels of Arx immediately activate Gcg expression to bias for α-fate selection. If a PPC has high UR2 methylation, it can only activate Pax4 but not Arx to favor β-cell fate.

Similar articles

Cited by

References

    1. Abranches E, Guedes AM, Moravec M, Maamar H, Svoboda P, Raj A, and Henrique D (2014). Stochastic NANOG fluctuations allow mouse embryonic stem cells to explore pluripotency. Development 141, 2770–2779. - PMC - PubMed
    1. Arnes L, Hill JT, Gross S, Magnuson MA, and Sussel L (2012). Ghrelin expression in the mouse pancreas defines a unique multipotent progenitor population. PLoS One 7, e52026. - PMC - PubMed
    1. Bastidas-Ponce A, Scheibner K, Lickert H, and Bakhti M (2017). Cellular and molecular mechanisms coordinating pancreas development. Development 144, 2873–2888. - PubMed
    1. Belteki G, Haigh J, Kabacs N, Haigh K, Sison K, Costantini F, Whitsett J, Quaggin SE, and Nagy A (2005). Conditional and inducible transgene expression in mice through the combinatorial use of Cre-mediated recombination and tetracycline induction. Nucleic Acids Res 33, e51. - PMC - PubMed
    1. Benitez CM, Qu K, Sugiyama T, Pauerstein PT, Liu Y, Tsai J, Gu X, Ghodasara A, Arda HE, Zhang J, et al. (2014). An integrated cell purification and genomics strategy reveals multiple regulators of pancreas development. PLoS Genet 10, e1004645. - PMC - PubMed

Publication types

MeSH terms

Substances