

Effect of Wakame and Carob Pod Snacks on Non-Alcoholic Fatty Liver Disease
- PMID: 30621142
- PMCID: PMC6356417
- DOI: 10.3390/nu11010086
Effect of Wakame and Carob Pod Snacks on Non-Alcoholic Fatty Liver Disease
Abstract
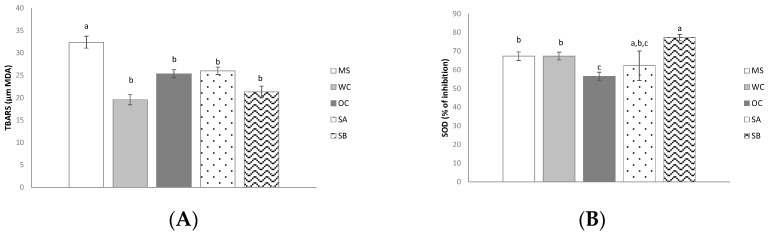
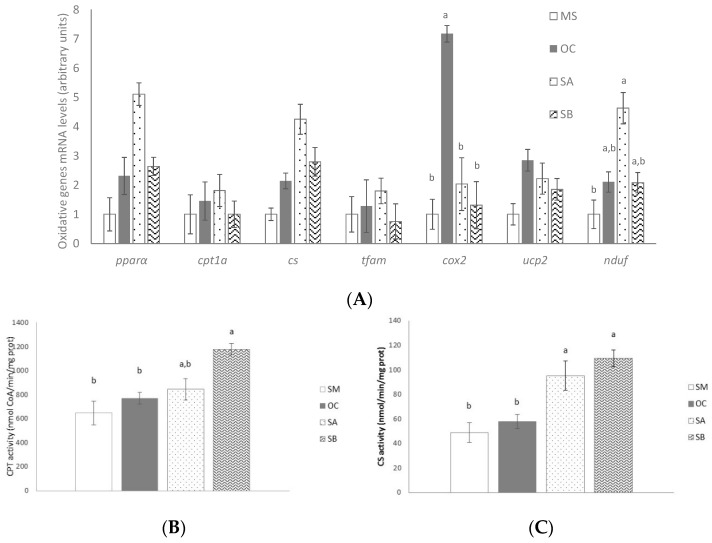
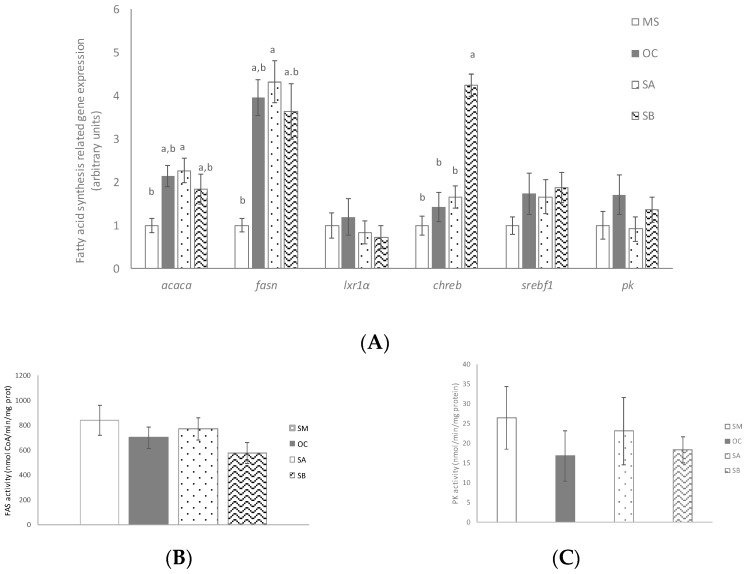
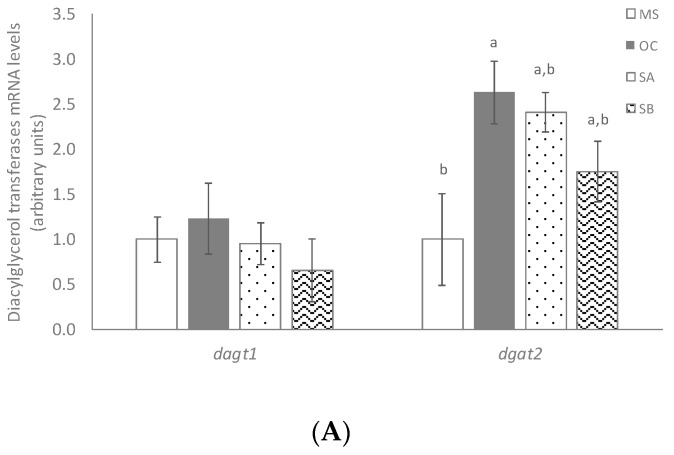
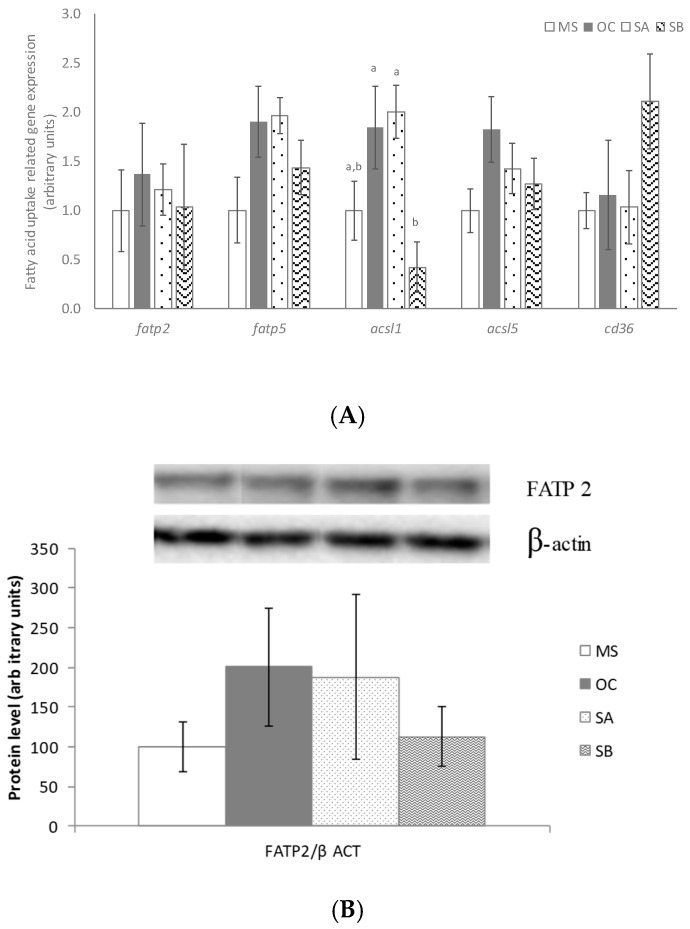
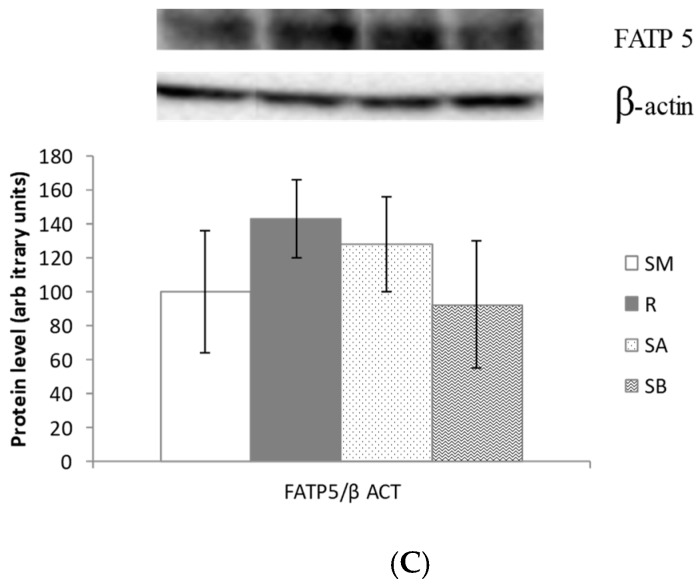
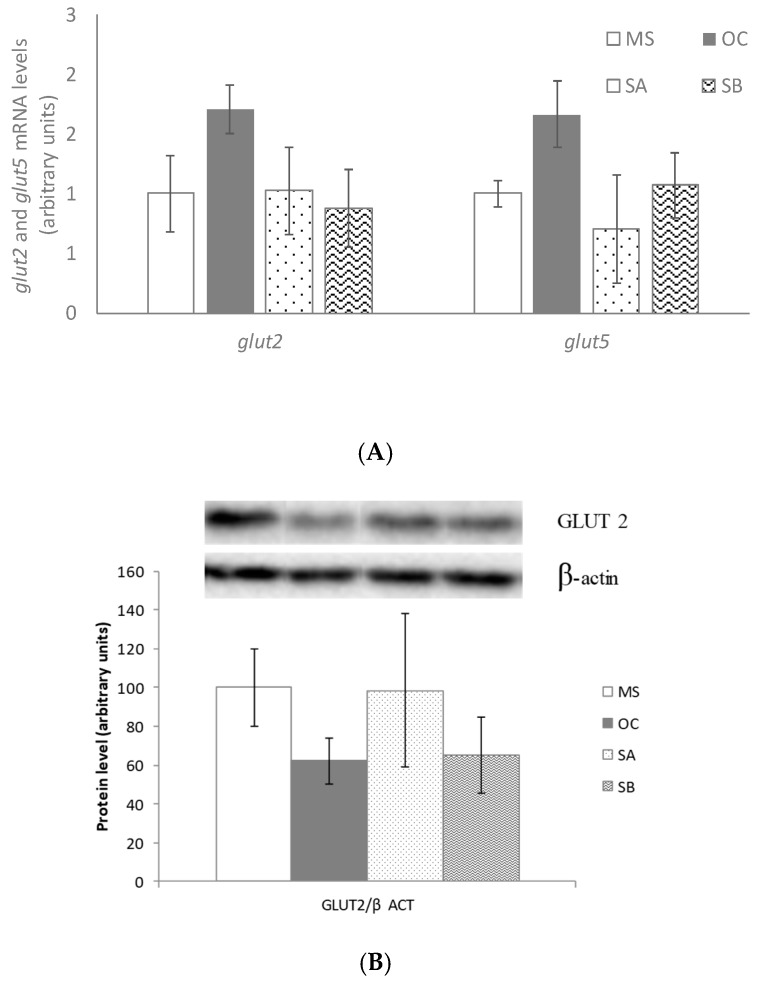
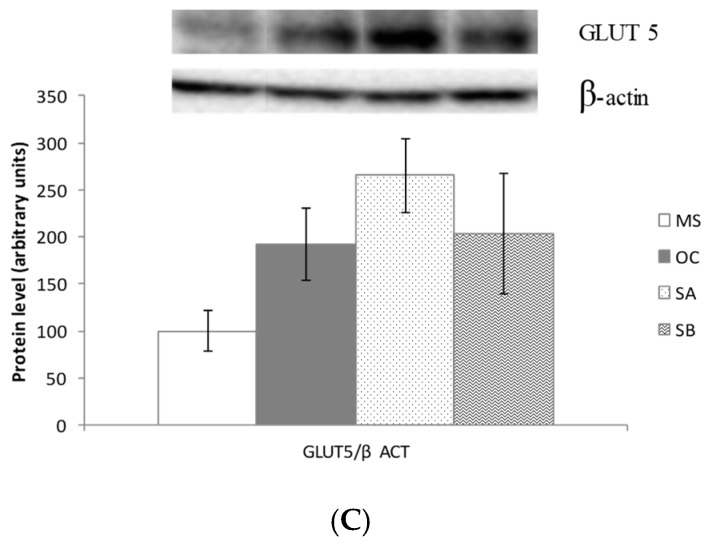
Snacks combining different functional ingredients could represent a useful therapeutic strategy against NAFLD. The present study aimed to analyze the effect of two snack formulations based on carob and wakame flour in the treatment for NAFLD in rats. For this purpose, metabolic syndrome was induced in 50 adult rats by a high-fat high-fructose diet over eight weeks. After this period, rats were fed either normal calorie diets supplemented or not with snack A (1/50 wakame/carob pod) and snack B (1/5 wakame/carob pod) for four additional weeks. After sacrifice, liver composition and serum parameters were analyzed. Different pathways of triacylglycerol metabolism in liver were studied including fatty acid oxidation, fatty acid synthesis, triglyceride assembly and release, fatty acid uptake and glucose uptake. Oxidative stress was also measured. Snack treatment, and mainly B snack, reduced liver triacylglycerol levels by increasing fat oxidation. Moreover, this snack reduced oxidative stress. Therefore, this snack formulation could represent an interesting tool useful for fatty liver treatment.
Keywords: NAFLD; carob; snack; steatohepatitis; wakame.
Conflict of interest statement
The authors declare no conflict of interest.
Figures

Similar articles
-
Potential Usefulness of a Wakame/Carob Functional Snack for the Treatment of Several Aspects of Metabolic Syndrome: From In Vitro to In Vivo Studies.Mar Drugs. 2018 Dec 17;16(12):512. doi: 10.3390/md16120512. Mar Drugs. 2018. PMID: 30562926 Free PMC article.
-
Effects of a snack enriched with carob and Undaria pinnatifida (wakame) on metabolic parameters in a double blind, randomized clinical trial in obese patients.Nutr Hosp. 2020 Jul 13;34(3):465-473. doi: 10.20960/nh.02906. Nutr Hosp. 2020. PMID: 32379474 Clinical Trial. English.
-
Dietary fish oil and Undaria pinnatifida (wakame) synergistically decrease rat serum and liver triacylglycerol.J Nutr. 2002 Apr;132(4):742-7. doi: 10.1093/jn/132.4.742. J Nutr. 2002. PMID: 11925471
-
Hepatic fatty acid oxidation enzyme activities are stimulated in rats fed the brown seaweed, Undaria pinnatifida (wakame).J Nutr. 1999 Jan;129(1):146-51. doi: 10.1093/jn/129.1.146. J Nutr. 1999. PMID: 9915891
-
Modulation of hepatic steatosis by dietary fatty acids.World J Gastroenterol. 2014 Feb 21;20(7):1746-55. doi: 10.3748/wjg.v20.i7.1746. World J Gastroenterol. 2014. PMID: 24587652 Free PMC article. Review.
Cited by
-
Effects of a Short-Term Meal Replacement Hypocaloric Diet in Subjects with Obesity and High Fatty Liver Index.Nutrients. 2022 Dec 16;14(24):5353. doi: 10.3390/nu14245353. Nutrients. 2022. PMID: 36558510 Free PMC article.
-
Supplementation with a Carob (Ceratonia siliqua L.) Fruit Extract Attenuates the Cardiometabolic Alterations Associated with Metabolic Syndrome in Mice.Antioxidants (Basel). 2020 Apr 21;9(4):339. doi: 10.3390/antiox9040339. Antioxidants (Basel). 2020. PMID: 32326269 Free PMC article.
-
Carob: A Sustainable Opportunity for Metabolic Health.Foods. 2022 Jul 20;11(14):2154. doi: 10.3390/foods11142154. Foods. 2022. PMID: 35885396 Free PMC article. Review.
-
Liver, Oxidative Stress and Metabolic Syndromes.Nutrients. 2021 Jan 21;13(2):301. doi: 10.3390/nu13020301. Nutrients. 2021. PMID: 33494242 Free PMC article.
References
MeSH terms
Substances
Grants and funding
LinkOut - more resources
Full Text Sources
Medical
