

The Marine Boundary Layer Height over the Western North Pacific Based on GPS Radio Occultation, Island Soundings, and Numerical Models
- PMID: 30621168
- PMCID: PMC6339253
- DOI: 10.3390/s19010155
The Marine Boundary Layer Height over the Western North Pacific Based on GPS Radio Occultation, Island Soundings, and Numerical Models
Abstract
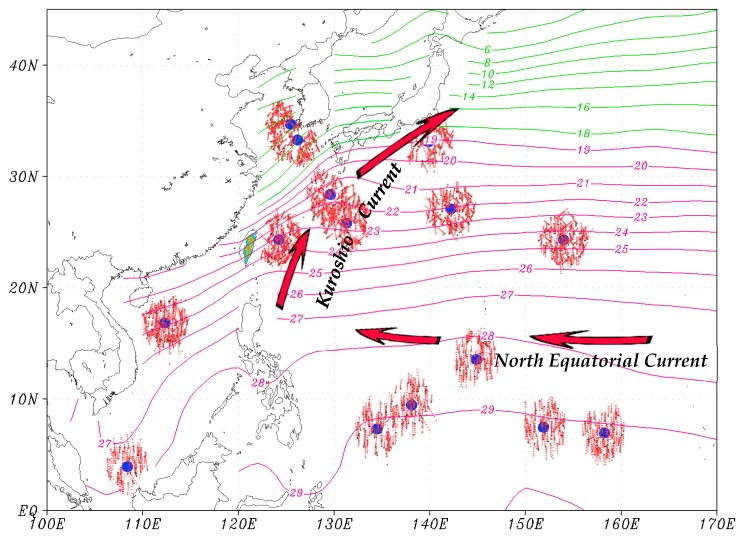
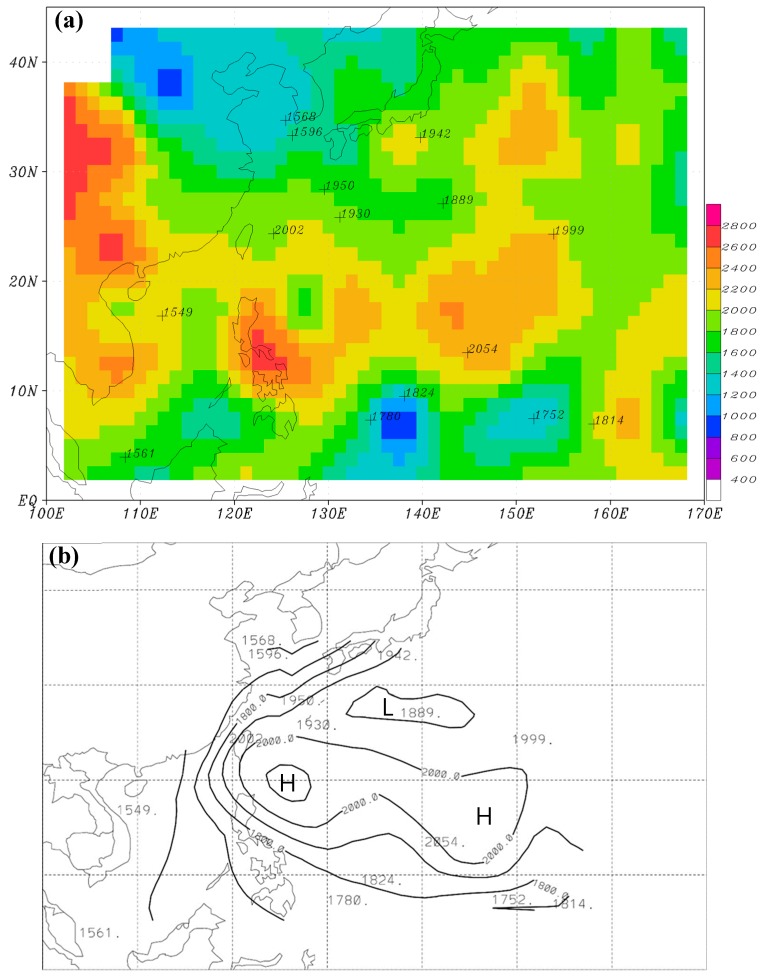
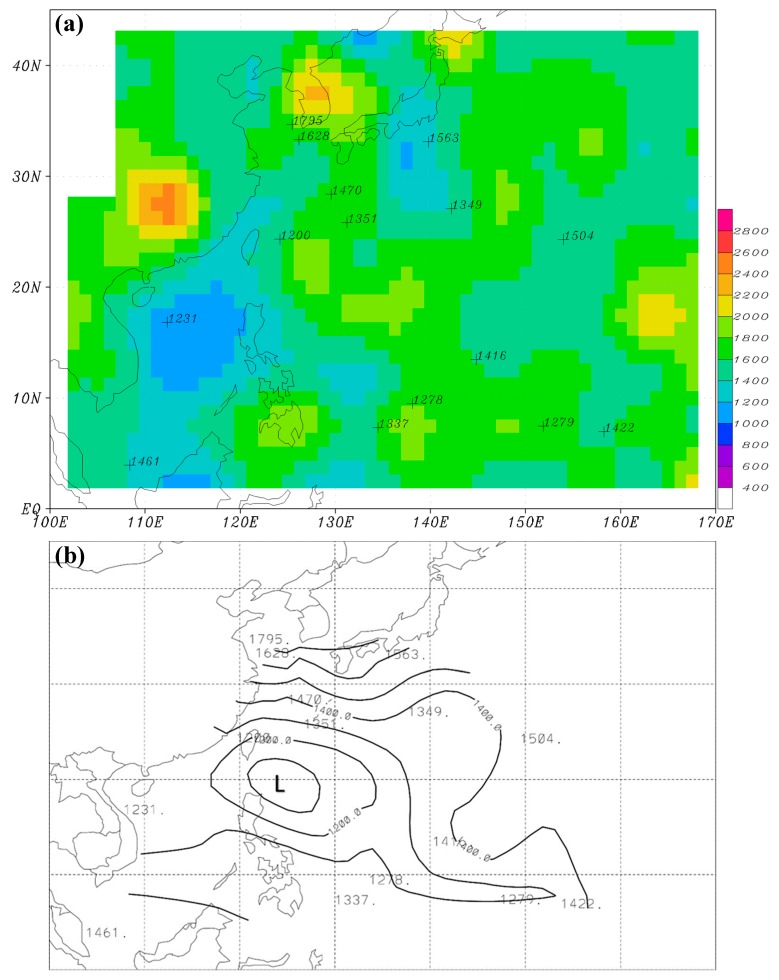
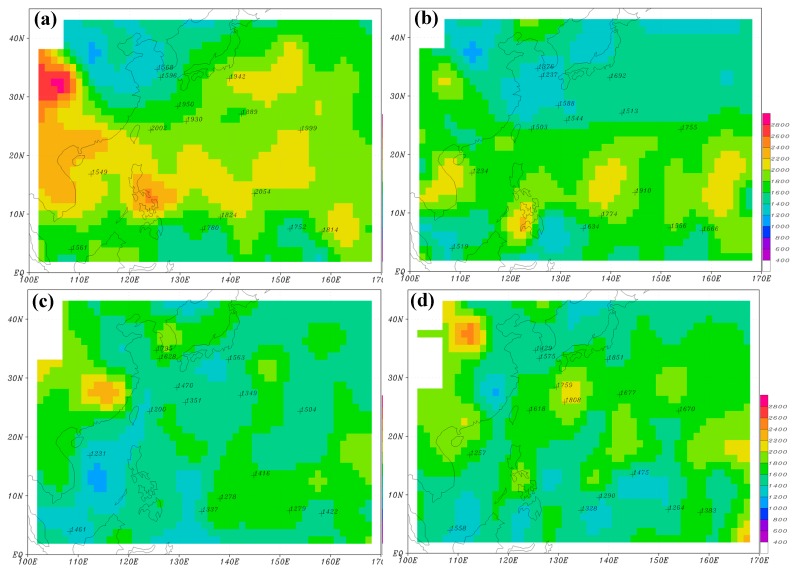
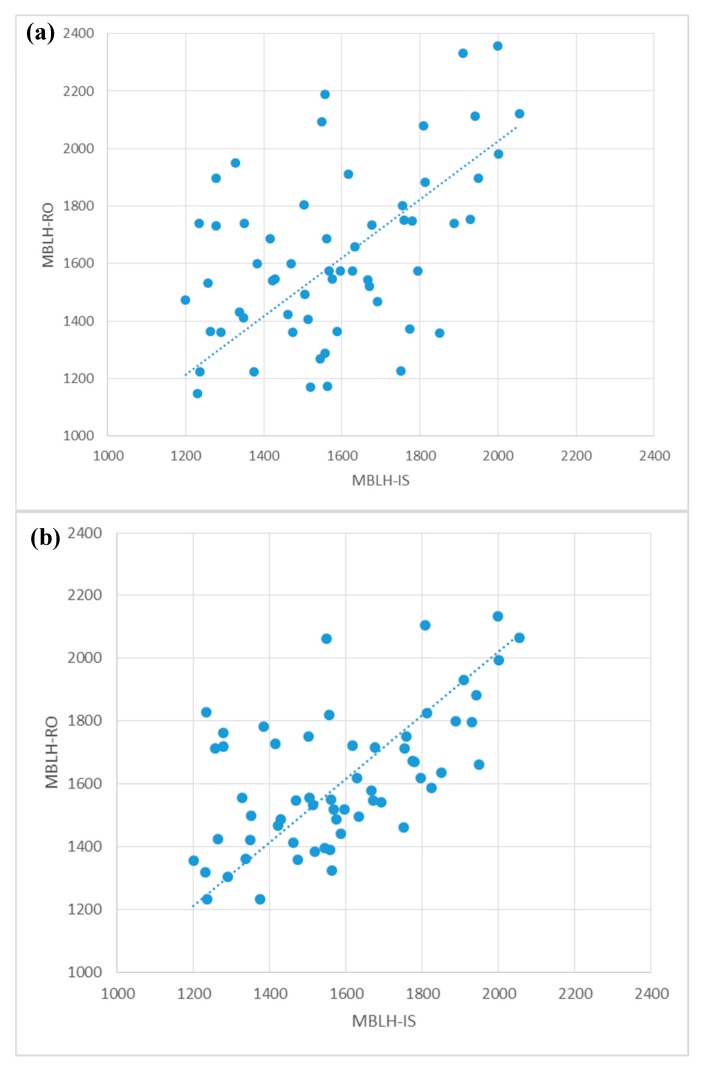
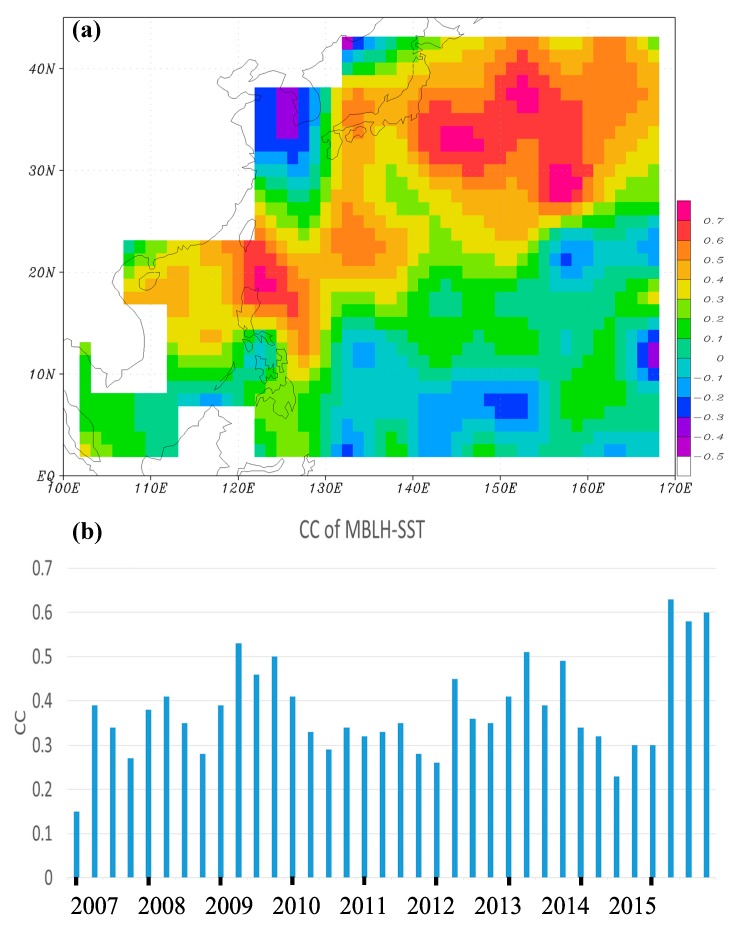
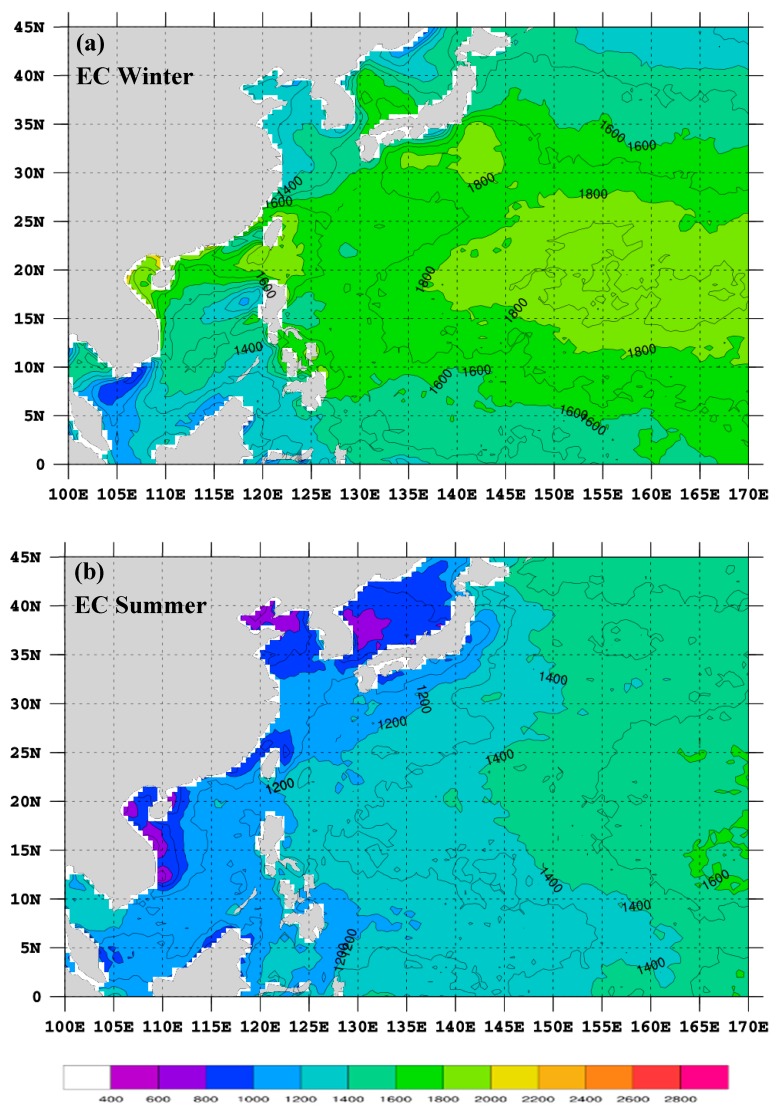
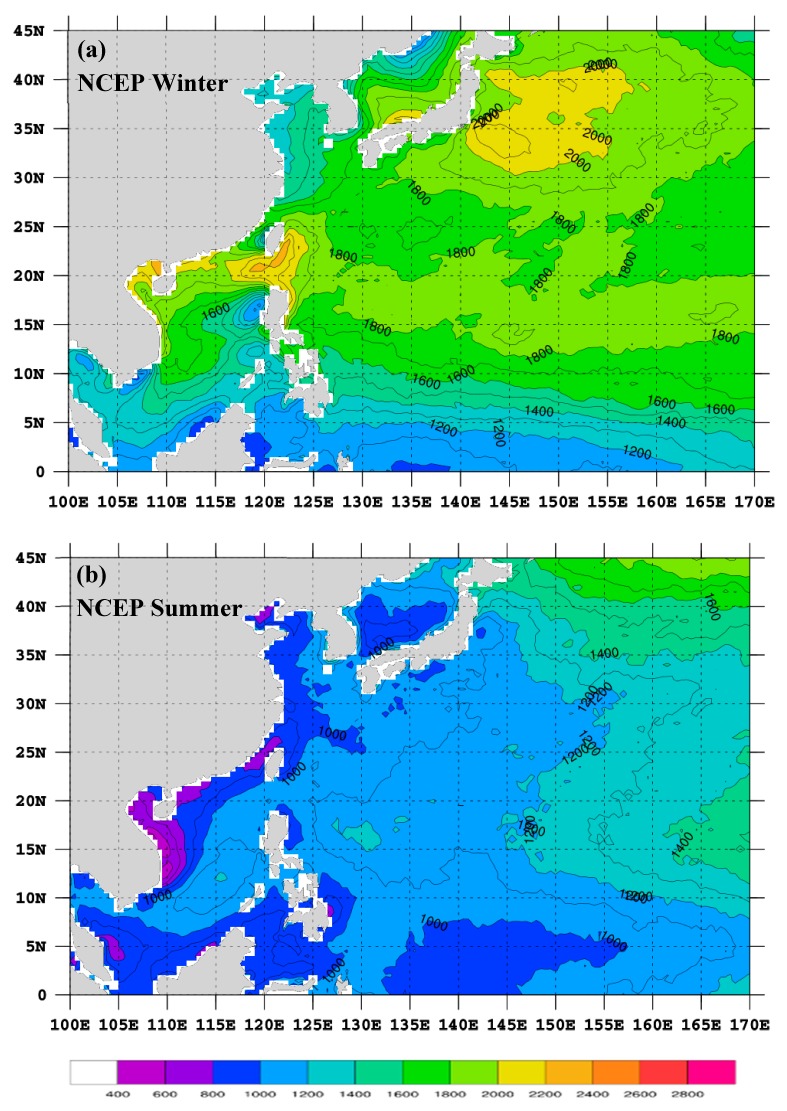
This paper estimates marine boundary layer height (MBLH) over the western North Pacific (WNP) based on Global Positioning System Radio Occultation (GPS-RO) profiles from the Formosa Satellite Mission 3 (FORMOSAT-3)/Constellation Observing System for Meteorology, Ionosphere, and Climate (COSMIC) satellites, island soundings, and numerical models. The seasonally-averaged MBLHs computed from nine years (2007⁻2015) of GPS-RO data are inter-compared with those obtained from sounding observations at 15 island stations and from the European Centre for Medium-Range Weather Forecasts (ECMWF) Reanalysis (ERA-Interim) and National Centers for Environmental Prediction Global Forecast System (NCEP GFS) data over the WNP from 2012 to 2015. It is found that the MBLH using nine years of GPS-RO data is smoother and more consistent with that obtained from sounding observations than is the MBLH using four years of GPS-RO data in a previous study. In winter, higher MBLHs are found around the subtropical latitudes and over oceans east of Japan, which are approximately located within the paths of the North Equatorial Current and the Kuroshio Current. The MBLH is also significantly higher in winter than in summer over the WNP. The above MBLH pattern is generally similar to those obtained from the analysis data of the ERA-Interim and NCEP GFS, but the heights are about 200 m higher. The verification with soundings suggests that the ERA-Interim has a better MBLH estimation than the NCEP GFS. Thus, the MBLH distributions obtained from both the nine-year GPS-RO and the ERA-Interim data can represent well the climatological MBLH over the WNP, but the heights should be adjusted about 30 m lower for the former and ~200 m higher for the latter. A positive correlation between the MBLH and the instability of the lower atmosphere exists over large near-shore areas of the WNP, where cold air can move over warm oceans from the land in winter, resulting in an increase in lower-atmospheric instability and providing favorable conditions for convection to yield a higher MBLH. During summer, the lower-atmospheric instability becomes smaller and the MBLH is thus lower over near-shore oceans.
Keywords: FORMOSAT-3/COSMIC; GPS radio occultation; marine boundary layer height.
Conflict of interest statement
The authors declare no conflict of interest.
Figures
Similar articles
-
Marine Boundary Layer Height Obtained by New Numerical Regularization Method Based on GPS Radio Occultation Data.Sensors (Basel). 2020 Aug 23;20(17):4762. doi: 10.3390/s20174762. Sensors (Basel). 2020. PMID: 32842518 Free PMC article.
-
Space Weather Observations by GNSS Radio Occultation: From FORMOSAT-3/COSMIC to FORMOSAT-7/COSMIC-2.Space Weather. 2014 Nov;12(11):616-621. doi: 10.1002/2014SW001133. Epub 2014 Nov 6. Space Weather. 2014. PMID: 26213514 Free PMC article.
-
Derivation of global ionospheric Sporadic E critical frequency (f o Es) data from the amplitude variations in GPS/GNSS radio occultations.R Soc Open Sci. 2020 Jul 22;7(7):200320. doi: 10.1098/rsos.200320. eCollection 2020 Jul. R Soc Open Sci. 2020. PMID: 32874629 Free PMC article.
-
Characteristics of atmospheric gravity waves observed using the MU (Middle and Upper atmosphere) radar and GPS (Global Positioning System) radio occultation.Proc Jpn Acad Ser B Phys Biol Sci. 2014;90(1):12-27. doi: 10.2183/pjab.90.12. Proc Jpn Acad Ser B Phys Biol Sci. 2014. PMID: 24492645 Free PMC article. Review.
-
Moving towards a Network of Autonomous UAS Atmospheric Profiling Stations for Observations in the Earth's Lower Atmosphere: The 3D Mesonet Concept.Sensors (Basel). 2019 Jun 17;19(12):2720. doi: 10.3390/s19122720. Sensors (Basel). 2019. PMID: 31213000 Free PMC article. Review.
Cited by
-
Marine Boundary Layer Height Obtained by New Numerical Regularization Method Based on GPS Radio Occultation Data.Sensors (Basel). 2020 Aug 23;20(17):4762. doi: 10.3390/s20174762. Sensors (Basel). 2020. PMID: 32842518 Free PMC article.
References
-
- Wood R. Stratocumulus clouds. Mon. Weather Rev. 2012;140:2373–2423. doi: 10.1175/MWR-D-11-00121.1. - DOI
-
- Sokolovskiy S.V., Kuo Y.-H., Rocken C., Schreiner W.S., Hunt D., Anthes R.A. Monitoring the atmospheric boundary layer by GPS radio occultation signals recorded in the open-loop mode. Geophys. Res. Lett. 2006;33:L12813. doi: 10.1029/2006GL025955. - DOI
-
- Sokolovskiy S.V., Rocken C., Lenschow D.H., Kuo Y.-H., Anthes R.A., Schreiner W.S., Hunt D.C. Observing the moist troposphere with radio occultation signals from COSMIC. Geophys. Res. Lett. 2007;34:L18802. doi: 10.1029/2007GL030458. - DOI
-
- Basha G., Ratnam M.V. Identification of atmospheric boundary layer height over a tropical station using high-resolution radiosonde refractivity profiles: Comparison with GPS radio occultation measurements. J. Geophys. Res. 2009;114:D16101. doi: 10.1029/2008JD011692. - DOI
Grants and funding
LinkOut - more resources
Full Text Sources
Research Materials
